Greenfield Union Elementary School
Rating
Not Available
Not Available

No Reviews Yet
Find Old Friends From Greenfield Union Elementary School
Use the form below to search for alumni from Greenfield Union Elementary School.
School Description
School Summary and Highlights
- Enrolls 519 elementary school students from grades KG-8
- Ranks 634th out of 809 middle schools in MI.
Additional Contact Information
- Mailing Address: 420 W. 7 Mile Road, Detroit, MI 48203
- Principal or Admin: Beverly Campbell
- Fax: (313) 866-2633
School Operational Details
- Title I EligibleAll students of this school are eligible for participation in authorized programs.
School District Details
- Detroit City School District
- Per-Pupil Spending: $12,016
- Graduation Rate: 45.2%
- Dropout Rate: 11.7%
- Students Per Teacher: 17.8
- Enrolled Students: 89,561
Faculty Details and Student Enrollment
Students and Faculty
- Total Students Enrolled: 519
- Total Full Time "Equivalent" Teachers: 28.0
- Average Student-To-Teacher Ratio: 18.5
Students Gender Breakdown
- Males: 253 (48.7%)
- Females: 266 (51.3%)
Free Lunch Student Eligibility Breakdown
- Eligible for Reduced Lunch: 8 (1.5%)
- Eligible for Free Lunch: 381 (73.4%)
- Eligible for Either Reduced or Free Lunch: 389 (75.0%)
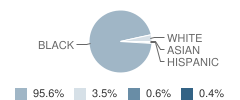
Student Enrollment Distribution by Race / Ethnicity
| Number | Percent | |
|---|---|---|
| American Indian | - | - |
| Black | 496 | 95.6% |
| Asian | 2 | 0.4% |
| Hispanic | 3 | 0.6% |
| White | 18 | 3.5% |
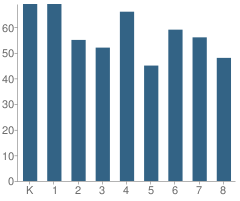
Number of Students Per Grade
| Number | Percent | |
|---|---|---|
| Kindergarten | 69 | 13.3% |
| 1st Grade | 69 | 13.3% |
| 2nd Grade | 55 | 10.6% |
| 3rd Grade | 52 | 10.0% |
| 4th Grade | 66 | 12.7% |
| 5th Grade | 45 | 8.7% |
| 6th Grade | 59 | 11.4% |
| 7th Grade | 56 | 10.8% |
| 8th Grade | 48 | 9.2% |
Source: MI Department of Education, Source: NCES 2009-2010
School Ratings and Reviews
Be The First To Review Greenfield Union Elementary School!
School Map and Similar Schools Nearby
Click to Activate Map of Nearby School Campuses
Private
Public
This School
Similar Schools Nearby
| Nolan Middle School KG-8 | 825 Students | 0.9 miles away | Not Yet Rated | |
| Ford Academy for Comm / Perf Arts KG-8 | 422 Students | 1.5 miles away | Not Yet Rated | |
| Barbara Jordan Elementary School KG-8 | 575 Students | 1.6 miles away | Not Yet Rated | |
| Webster School KG-5 | 332 Students | 1.7 miles away | Not Yet Rated | |
| United Oaks Elementary School KG-5 | 373 Students | 1.8 miles away | Not Yet Rated | |
| Mason Elementary School KG-5 | 370 Students | 1.8 miles away | Not Yet Rated | |
| Pasteur Elementary School KG-6 | 360 Students | 1.9 miles away |  5 out of 5 | |
| Marshall, Thurgood Elementary School KG-6 | 365 Students | 2.1 miles away | Not Yet Rated | |
| Schofield Elementary School KG-5 | 417 Students | 2.2 miles away | 5 out of 5 | |
| Bagley Elementary School KG-6 | 473 Students | 2.3 miles away | 5 out of 5 | |
Compare This School To Nearby Schools ->
School Community Forum

Join a discussion about Greenfield Union Elementary School and talk to others in the community including students, parents, teachers, and administrators.
Popular Discussion Topics
- Admissions and Registration Questions (e.g. Dress Code and Discipline Policy)
- School Calendar and Upcoming Events (e.g. Graduation)
- After School Programs, Extracurricular Activities, and Athletics (e.g. Football)
- News and Announcements (e.g. Yearbook and Class Supply List Details)
- Graduate and Alumni Events (e.g. Organizing Class Reunions)
Navigation
Can't Find What You Are Looking For?
Rankings
Nearby Cities
Sponsored Links
K-12 Articles

School Violence: Can It Be Stopped
It’s a fact that violence in schools is prevalent in today’s society. We hear of school shootings,...
It’s a fact that violence in schools is prevalent in today’s society. We hear of school shootings,...

Preparing Your Child for the First Day of School
It seems like school was just dismissed for the summer, yet here we are facing another year of back...
It seems like school was just dismissed for the summer, yet here we are facing another year of back...

Hurt: A Book Report
My last book report was over 15 years ago, and I’m a bit rusty, but here goes (Don’t forget: book...
My last book report was over 15 years ago, and I’m a bit rusty, but here goes (Don’t forget: book...