Bethune Academy
Rating
Not Available
Not Available

No Reviews Yet
Find Old Friends From Bethune Academy
Use the form below to search for alumni from Bethune Academy.
School Description
School Summary and Highlights
- Enrolls 629 elementary school students from grades KG-8
- Ranks 805th out of 809 middle schools in MI.
Additional Contact Information
- Mailing Address: 10825 Fenkell Street, Detroit, MI 48227
- Principal or Admin: Mrs. Pamela Askew
- Fax: (313) 873-9459
School Operational Details
- Title I EligibleAll students of this school are eligible for participation in authorized programs.
School District Details
- Detroit City School District
- Per-Pupil Spending: $12,016
- Graduation Rate: 45.2%
- Dropout Rate: 11.7%
- Students Per Teacher: 17.8
- Enrolled Students: 89,561
Faculty Details and Student Enrollment
Students and Faculty
- Total Students Enrolled: 629
- Total Full Time "Equivalent" Teachers: 40.0
- Average Student-To-Teacher Ratio: 15.7
Students Gender Breakdown
- Males: 322 (51.2%)
- Females: 307 (48.8%)
Free Lunch Student Eligibility Breakdown
- Eligible for Reduced Lunch: 8 (1.3%)
- Eligible for Free Lunch: 522 (83.0%)
- Eligible for Either Reduced or Free Lunch: 530 (84.3%)
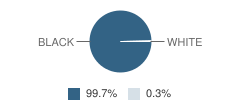
Student Enrollment Distribution by Race / Ethnicity
| Number | Percent | |
|---|---|---|
| American Indian | - | - |
| Black | 627 | 99.7% |
| Asian | - | - |
| Hispanic | - | - |
| White | 2 | 0.3% |
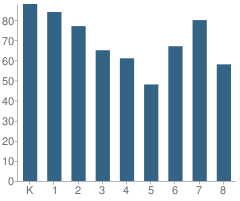
Number of Students Per Grade
| Number | Percent | |
|---|---|---|
| Kindergarten | 88 | 14.0% |
| 1st Grade | 84 | 13.4% |
| 2nd Grade | 77 | 12.2% |
| 3rd Grade | 65 | 10.3% |
| 4th Grade | 61 | 9.7% |
| 5th Grade | 48 | 7.6% |
| 6th Grade | 67 | 10.7% |
| 7th Grade | 80 | 12.7% |
| 8th Grade | 58 | 9.2% |
| Ungraded | 1 | 0.2% |
Source: MI Department of Education, Source: NCES 2009-2010
School Ratings and Reviews
Be The First To Review Bethune Academy!
School Map and Similar Schools Nearby
Click to Activate Map of Nearby School Campuses
Private
Public
This School
Similar Schools Nearby
| Fitzgerald Elementary School KG-8 | 575 Students | 1.0 miles away | Not Yet Rated | |
| King, John R. Academic and Performing Arts Academy KG-8 | 867 Students | 1.1 miles away | Not Yet Rated | |
| Young, Coleman A. Elementary School KG-5 | 599 Students | 1.1 miles away |  3 out of 5 | |
| Schulze Elementary School KG-7 | 704 Students | 1.1 miles away | Not Yet Rated | |
| Burns Elementary School KG-8 | 671 Students | 1.3 miles away | Not Yet Rated | |
| Noble Elementary School KG-8 | 528 Students | 1.6 miles away |  2.5 out of 5 | |
| Foreign Language Immersion School KG-8 | 635 Students | 1.6 miles away |  4 out of 5 | |
| Bagley Elementary School KG-6 | 473 Students | 1.7 miles away |  5 out of 5 | |
| Hancock School KG-8 | 43 Students | 1.8 miles away | Not Yet Rated | |
| Oakman Elementary School KG-5 | 242 Students | 1.8 miles away | Not Yet Rated | |
Compare This School To Nearby Schools ->
School Community Forum

Join a discussion about Bethune Academy and talk to others in the community including students, parents, teachers, and administrators.
Popular Discussion Topics
- Admissions and Registration Questions (e.g. Dress Code and Discipline Policy)
- School Calendar and Upcoming Events (e.g. Graduation)
- After School Programs, Extracurricular Activities, and Athletics (e.g. Football)
- News and Announcements (e.g. Yearbook and Class Supply List Details)
- Graduate and Alumni Events (e.g. Organizing Class Reunions)
Navigation
Can't Find What You Are Looking For?
Rankings
Nearby Cities
Sponsored Links
K-12 Articles

Teaching Your Child Study Skills
Many children who have the capability to get good grades experience frustration because of low...
Many children who have the capability to get good grades experience frustration because of low...

Hurt: A Book Report
My last book report was over 15 years ago, and I’m a bit rusty, but here goes (Don’t forget: book...
My last book report was over 15 years ago, and I’m a bit rusty, but here goes (Don’t forget: book...

Cutting Class
Depression is a very real problem for today’s youth. When your spirit doesn’t feel good, a lot of...
Depression is a very real problem for today’s youth. When your spirit doesn’t feel good, a lot of...