Law Elementary School
Rating
Not Available
Not Available

No Reviews Yet
Find Old Friends From Law Elementary School
Use the form below to search for alumni from Law Elementary School.
School Description
School Summary and Highlights
- Enrolls 881 elementary school students from grades KG-8
- Ranks 779th out of 809 middle schools in MI.
Additional Contact Information
- Mailing Address: 19411 Cliff Avenue, Detroit, MI 48234
- Principal or Admin: Dr. Frano Ivezaj
- Fax: (313) 866-6200
School Operational Details
- Title I EligibleAll students of this school are eligible for participation in authorized programs.
School District Details
- Detroit City School District
- Per-Pupil Spending: $12,016
- Graduation Rate: 45.2%
- Dropout Rate: 11.7%
- Students Per Teacher: 17.8
- Enrolled Students: 89,561
Faculty Details and Student Enrollment
Students and Faculty
- Total Students Enrolled: 881
- Total Full Time "Equivalent" Teachers: 51.0
- Average Student-To-Teacher Ratio: 17.3
Students Gender Breakdown
- Males: 467 (53.0%)
- Females: 414 (47.0%)
Free Lunch Student Eligibility Breakdown
- Eligible for Reduced Lunch: 11 (1.2%)
- Eligible for Free Lunch: 754 (85.6%)
- Eligible for Either Reduced or Free Lunch: 765 (86.8%)
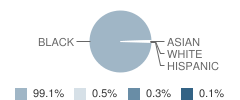
Student Enrollment Distribution by Race / Ethnicity
| Number | Percent | |
|---|---|---|
| American Indian | - | - |
| Black | 873 | 99.1% |
| Asian | 1 | 0.1% |
| Hispanic | 3 | 0.3% |
| White | 4 | 0.5% |
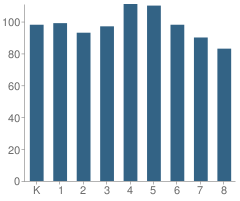
Number of Students Per Grade
| Number | Percent | |
|---|---|---|
| Kindergarten | 98 | 11.1% |
| 1st Grade | 99 | 11.2% |
| 2nd Grade | 93 | 10.6% |
| 3rd Grade | 97 | 11.0% |
| 4th Grade | 111 | 12.6% |
| 5th Grade | 110 | 12.5% |
| 6th Grade | 98 | 11.1% |
| 7th Grade | 90 | 10.2% |
| 8th Grade | 83 | 9.4% |
| Ungraded | 2 | 0.2% |
Source: MI Department of Education, Source: NCES 2009-2010
School Ratings and Reviews
Be The First To Review Law Elementary School!
School Map and Similar Schools Nearby
Click to Activate Map of Nearby School Campuses
Private
Public
This School
Similar Schools Nearby
| Farwell Middle School 5-8 | 460 Students | 1.3 miles away |  1 out of 5 | |
| Van Zile Elementary School KG-4 | 435 Students | 1.3 miles away | Not Yet Rated | |
| Pulaski Elementary School KG-8 | 653 Students | 1.5 miles away | Not Yet Rated | |
| Mound Park Elementary School KG-5 | 367 Students | 1.6 miles away | Not Yet Rated | |
| Fleming Elementary School KG-5 | 758 Students | 1.8 miles away | Not Yet Rated | |
| Washington Elementary School KG-5 | 367 Students | 2.1 miles away | 1 out of 5 | |
| White Elementary School KG-8 | 780 Students | 2.1 miles away | Not Yet Rated | |
| Wilkins Elementary School KG-6 | 389 Students | 2.1 miles away | Not Yet Rated | |
| Miller Elementary School KG-5 | 350 Students | 2.2 miles away | Not Yet Rated | |
| Mason Elementary School KG-5 | 370 Students | 2.3 miles away | Not Yet Rated | |
Compare This School To Nearby Schools ->
School Community Forum

Join a discussion about Law Elementary School and talk to others in the community including students, parents, teachers, and administrators.
Popular Discussion Topics
- Admissions and Registration Questions (e.g. Dress Code and Discipline Policy)
- School Calendar and Upcoming Events (e.g. Graduation)
- After School Programs, Extracurricular Activities, and Athletics (e.g. Football)
- News and Announcements (e.g. Yearbook and Class Supply List Details)
- Graduate and Alumni Events (e.g. Organizing Class Reunions)
Navigation
Can't Find What You Are Looking For?
Rankings
Nearby Cities
Sponsored Links
K-12 Articles

Just a Harmless Vanilla Bean?
Some of the greatest, most used, and most profitable breakthroughs in science have not been made by...
Some of the greatest, most used, and most profitable breakthroughs in science have not been made by...

Changing Schools Isn't Easy: Tips for a Successful Transition
It isn’t easy for students to make the transition into a new school, especially if they have...
It isn’t easy for students to make the transition into a new school, especially if they have...

Attend Your Teen's Holiday Parties
Christmas and New Years are coming, and with them Christmas and New Years Eve parties. At many of...
Christmas and New Years are coming, and with them Christmas and New Years Eve parties. At many of...