Johannesburg Elementary / Middle School
Rating
Not Available
Not Available

No Reviews Yet
Find Old Friends From Johannesburg Elementary / Middle School
Use the form below to search for alumni from Johannesburg Elementary / Middle School.
School Description
School Summary and Highlights
- Enrolls 230 elementary and middle school students from grades KG-8
- Ranks 185th out of 809 middle schools in MI.
Additional Contact Information
- Mailing Address: PO Box 69, Johannesburg, MI 49751
- Principal or Admin: Mr. Thomas Hausbeck
- Fax: (989) 732-6556
- Website: www.jlas.org
School Operational Details
- Title I Eligible
School District Details
- Johannesburg-Lewiston Area Schools District
- Per-Pupil Spending: $8,914
- Graduation Rate: 59.4%
- Dropout Rate: 5.8%
- Students Per Teacher: 15.0
- Enrolled Students: 797
Faculty Details and Student Enrollment
Students and Faculty
- Total Students Enrolled: 230
- Total Full Time "Equivalent" Teachers: 14.8
- Average Student-To-Teacher Ratio: 15.6
Students Gender Breakdown
- Males: 119 (51.7%)
- Females: 111 (48.3%)
Free Lunch Student Eligibility Breakdown
- Eligible for Reduced Lunch: 22 (9.6%)
- Eligible for Free Lunch: 74 (32.2%)
- Eligible for Either Reduced or Free Lunch: 96 (41.7%)
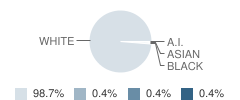
Student Enrollment Distribution by Race / Ethnicity
| Number | Percent | |
|---|---|---|
| American Indian | 1 | 0.4% |
| Black | 1 | 0.4% |
| Asian | 1 | 0.4% |
| Hispanic | - | - |
| White | 227 | 98.7% |
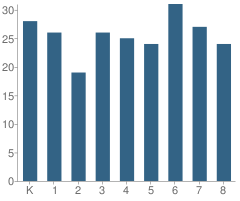
Number of Students Per Grade
| Number | Percent | |
|---|---|---|
| Kindergarten | 28 | 12.2% |
| 1st Grade | 26 | 11.3% |
| 2nd Grade | 19 | 8.3% |
| 3rd Grade | 26 | 11.3% |
| 4th Grade | 25 | 10.9% |
| 5th Grade | 24 | 10.4% |
| 6th Grade | 31 | 13.5% |
| 7th Grade | 27 | 11.7% |
| 8th Grade | 24 | 10.4% |
Source: MI Department of Education, Source: NCES 2009-2010
School Ratings and Reviews
Be The First To Review Johannesburg Elementary / Middle School!
School Map and Similar Schools Nearby
Click to Activate Map of Nearby School Campuses
Private
Public
This School
Similar Schools Nearby
| Lewiston Elementary-Middle School KG-8 | 343 Students | 9.8 miles away | Not Yet Rated | |
| Gaylord Middle School 7-8 | 492 Students | 10.7 miles away | Not Yet Rated | |
| Gaylord Intermediate School 4-6 | 715 Students | 11.1 miles away | Not Yet Rated | |
| Gaylord High School / Vocational Building 7-12 | 1,038 Students | 11.6 miles away | Not Yet Rated | |
| Atlanta Community Schools KG-12 | 327 Students | 14.8 miles away | Not Yet Rated | |
| Vanderbilt Area School KG-12 | 162 Students | 15.1 miles away | Not Yet Rated | |
| Wolverine Elementary School KG-6 | 180 Students | 21.8 miles away | Not Yet Rated | |
| Wolverine Middle / High School 7-12 | 155 Students | 21.8 miles away | Not Yet Rated | |
| Grayling Middle School 6-8 | 402 Students | 25.0 miles away |  2.5 out of 5 | |
| Alba School KG-12 | 213 Students | 25.2 miles away | Not Yet Rated | |
Compare This School To Nearby Schools ->
School Community Forum

Join a discussion about Johannesburg Elementary / Middle School and talk to others in the community including students, parents, teachers, and administrators.
Popular Discussion Topics
- Admissions and Registration Questions (e.g. Dress Code and Discipline Policy)
- School Calendar and Upcoming Events (e.g. Graduation)
- After School Programs, Extracurricular Activities, and Athletics (e.g. Football)
- News and Announcements (e.g. Yearbook and Class Supply List Details)
- Graduate and Alumni Events (e.g. Organizing Class Reunions)
Navigation
Can't Find What You Are Looking For?
Rankings
Nearby Cities
Sponsored Links
K-12 Articles

What to Do when Your Child Hates School
All kids grumble about going to school at one time or another. This is perfectly normal, but what...
All kids grumble about going to school at one time or another. This is perfectly normal, but what...

It's the Most Wonderful Time of the Year!
For most of the country, school is starting up this week or later this month-at the beginning of...
For most of the country, school is starting up this week or later this month-at the beginning of...

Cutting Class
Depression is a very real problem for today's youth. When your spirit doesn't feel good, a lot of...
Depression is a very real problem for today's youth. When your spirit doesn't feel good, a lot of...