Stringer Attendance Center School
Rating
Not Available
Not Available

4 out of 5 | 2 Reviews
Find Old Friends From Stringer Attendance Center School
Use the form below to search for alumni from Stringer Attendance Center School.
School Description
School Summary and Highlights
- Enrolls 658 elementary, middle, and high school students from grades KG-12
- Ranks 105th out of 242 high schools in MS.
Additional Contact Information
- Mailing Address: P O Box 1068, Stringer, MS 39481
School District Details
- West Jasper Consolidated Schools District
- Per-Pupil Spending: $7,752
- Graduation Rate: 61.7%
- Dropout Rate: 4.0%
- Students Per Teacher: 15.7
- Enrolled Students: 1,590
Faculty Details and Student Enrollment
Students and Faculty
- Total Students Enrolled: 658
- Total Full Time "Equivalent" Teachers: 37.8
- Average Student-To-Teacher Ratio: 17.4
Students Gender Breakdown
- Males: 345 (52.4%)
- Females: 313 (47.6%)
Free Lunch Student Eligibility Breakdown
- Eligible for Reduced Lunch: 100 (15.2%)
- Eligible for Free Lunch: 323 (49.1%)
- Eligible for Either Reduced or Free Lunch: 423 (64.3%)
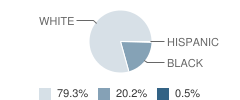
Student Enrollment Distribution by Race / Ethnicity
| Number | Percent | |
|---|---|---|
| American Indian | - | - |
| Black | 133 | 20.2% |
| Asian | - | - |
| Hispanic | 3 | 0.5% |
| White | 521 | 79.2% |
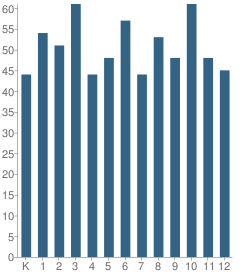
Number of Students Per Grade
| Number | Percent | |
|---|---|---|
| Kindergarten | 44 | 6.7% |
| 1st Grade | 54 | 8.2% |
| 2nd Grade | 51 | 7.8% |
| 3rd Grade | 61 | 9.3% |
| 4th Grade | 44 | 6.7% |
| 5th Grade | 48 | 7.3% |
| 6th Grade | 57 | 8.7% |
| 7th Grade | 44 | 6.7% |
| 8th Grade | 53 | 8.1% |
| 9th Grade | 48 | 7.3% |
| 10th Grade | 61 | 9.3% |
| 11th Grade | 48 | 7.3% |
| 12th Grade | 45 | 6.8% |
Faculty Educational Background (2006-07)
- Teachers with a Bachelor's Degree: 64%
- Teachers with a Master's Degree or Higher:36%
Faculty Salary and Experience (2006-2007)
- Average Teaching Experience: 16 Years
- Average Salary: $39,923
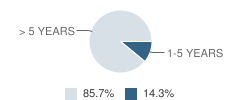
Teacher Experience by Number of Years
| Salary | Percent | |
|---|---|---|
| 1-5 Years of Teaching Experience | $33,230 | 14% |
| More Than 5 Years of Teaching Experience | $41,038 | 86% |
Source: MS Department of Education, Source: NCES 2009-2010
School Ratings and Reviews
Overall Rating: 4

4 out of 5 | 2 Reviews
The Overall Rating is the school's average rating from parents, students, school faculty and staff. The highest rating is five apples and the lowest is one apple.
Share Your Review About This School
2 reviews for Stringer Attendance Center School
- Reviewed by Parent or Guardian on March 03, 2011
- Rating:
 (3 / 5) Flag as inappropriate
 - The school is okay, but they misuse funds. The children do not have enough textbooks, but the school keeps building sports facilities. They need to get their priorities straight.
- Reviewed by Student on September 06, 2007
- Rating:
 (5 / 5) Flag as inappropriate
 - I have only been going to Stringer Attendance Center for a little while now, it isnt like my old school but the curriculum there is great...I was making A+ before,due to the change and adjustment I started to make D's & F's. So yeah I am saying it is a bit harder but,it is also a good school!
I have made great friends,and i realize that I concentrate more. There are probably a few changes that could be made like considering the students who like to start a lot of fights,but overall I like it there!
The teachers are great and the classes are harder!But,overall good school!So....A-
School Map and Similar Schools Nearby
Click to Activate Map of Nearby School Campuses
Private
Public
This School
Similar Schools Nearby
| Bay Springs High School 9-12 | 264 Students | 8.6 miles away |  5 out of 5 | |
| Taylorsville High School PK-12 | 879 Students | 9.9 miles away | Not Yet Rated | |
| Laurel High School 9-12 | 762 Students | 13.6 miles away | Not Yet Rated | |
| Heidelberg High School 7-12 | 336 Students | 16.3 miles away | Not Yet Rated | |
| Heidelberg Junior High School 7-8 | 168 Students | 16.3 miles away | Not Yet Rated | |
| Mize Attendance Center School PK-12 | 736 Students | 17.0 miles away | 5 out of 5 | |
| Raleigh High School 7-12 | 616 Students | 17.7 miles away | 5 out of 5 | |
| South Jones High School 7-12 | 1,178 Students | 18.5 miles away | Not Yet Rated | |
| Mount Olive Attendance Center School KG-12 | 474 Students | 24.4 miles away | 5 out of 5 | |
| Seminary Attendance Center School KG-12 | 386 Students | 25.3 miles away | Not Yet Rated | |
Compare This School To Nearby Schools ->
School Community Forum

Join a discussion about Stringer Attendance Center School and talk to others in the community including students, parents, teachers, and administrators.
Popular Discussion Topics
- Admissions and Registration Questions (e.g. Dress Code and Discipline Policy)
- School Calendar and Upcoming Events (e.g. Graduation)
- After School Programs, Extracurricular Activities, and Athletics (e.g. Football)
- News and Announcements (e.g. Yearbook and Class Supply List Details)
- Graduate and Alumni Events (e.g. Organizing Class Reunions)
Navigation
Can't Find What You Are Looking For?
Rankings
Nearby Cities
Sponsored Links
K-12 Articles

Educators and Childhood Obesity
Obesity in childhood is rising to epidemic proportions in America and educators should be...
Obesity in childhood is rising to epidemic proportions in America and educators should be...

Bullies... What Are They Good For?
Bullies have been around since the beginning of time. We had to deal with bullies, and our parents...
Bullies have been around since the beginning of time. We had to deal with bullies, and our parents...

Break the Cycle: Teen Dating Violence and Prevention Week
February 5 through 9 was “National Teen Dating Violence Awareness and Prevention Week”....
February 5 through 9 was “National Teen Dating Violence Awareness and Prevention Week”....