Bunceton High School
Rating
Not Available
Not Available

No Reviews Yet
Find Old Friends From Bunceton High School
Use the form below to search for alumni from Bunceton High School.
School Description
School Summary and Highlights
- Enrolls 82 middle and high school students from grades 7-12
- Ranks 237th out of 513 high schools in MO.
- 2010 Overall School AYP Met Status: Met
Additional Contact Information
- Mailing Address: PO Box 110, Bunceton, MO 65237
- Principal or Admin: Maurice Guerin
- Fax: (660) 427-5348
- Website: www:
School District Details
- Cooper County R-Iv School District
- Per-Pupil Spending: $11,497
- Graduation Rate: 70.0%
- Students Per Teacher: 8.9
- Enrolled Students: 148
Faculty Details and Student Enrollment
Students and Faculty
- Total Students Enrolled: 82
- Total Full Time "Equivalent" Teachers: 9.3
- Average Student-To-Teacher Ratio: 8.8
Students Gender Breakdown
- Males: 43 (52.4%)
- Females: 39 (47.6%)
Free Lunch Student Eligibility Breakdown
- Eligible for Reduced Lunch: 4 (4.9%)
- Eligible for Free Lunch: 41 (50.0%)
- Eligible for Either Reduced or Free Lunch: 45 (54.9%)
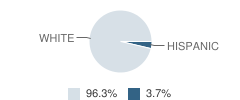
Student Enrollment Distribution by Race / Ethnicity
| Number | Percent | |
|---|---|---|
| American Indian | - | - |
| Black | - | - |
| Asian | - | - |
| Hispanic | 3 | 3.7% |
| White | 79 | 96.3% |
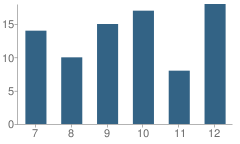
Number of Students Per Grade
| Number | Percent | |
|---|---|---|
| 7th Grade | 14 | 17.1% |
| 8th Grade | 10 | 12.2% |
| 9th Grade | 15 | 18.3% |
| 10th Grade | 17 | 20.7% |
| 11th Grade | 8 | 9.8% |
| 12th Grade | 18 | 22.0% |
Graduation and Dropout Rates (2010)
Graduation Rate
School:
100.0%
District:
100.0%
Dropout Rate
School:
5.0%
District:
5.0%
Post-Graduate Profiles (2010)
Percent Entering a 2-Year College: 8.3%
Percent Entering a 4-Year College: 25.0%
Percent Entering a Non-College Post-Secondary Institution: 8.3%
Percent Entering the Military: 8.3%
Faculty Information (2010)
Principal Years of Experience: 2.0
Teacher Average Years of Experience: 7.6
Faculty Salary (2010)
Average Salary of Teachers: $31,141
Teacher Credentials (2009)
Percent of Teachers with Regular Certificates
School:
100.0%
District:
100.0%
Source: MO Department of Education, Source: NCES 2009-2010
School Ratings and Reviews
Be The First To Review Bunceton High School!
School Map and Similar Schools Nearby
Click to Activate Map of Nearby School Campuses
Private
Public
This School
Similar Schools Nearby
| Prairie Home High School 7-12 | 85 Students | 3.9 miles away | Not Yet Rated | |
| Moniteau County High School 7-12 | 93 Students | 9.7 miles away | Not Yet Rated | |
| California High School 9-12 | 429 Students | 11.0 miles away | Not Yet Rated | |
| Tipton High School 7-12 | 302 Students | 11.5 miles away | Not Yet Rated | |
| Boonville High School 9-12 | 571 Students | 12.5 miles away | Not Yet Rated | |
| Pilot Grove High School 9-12 | 121 Students | 15.1 miles away | Not Yet Rated | |
| New Franklin Middle-High School 6-12 | 225 Students | 16.8 miles away | Not Yet Rated | |
| Rock Bridge Sr. High School PK-12 | 1,832 Students | 18.9 miles away |  5 out of 5 | |
| West Jr. High School 8-9 | 889 Students | 19.7 miles away | 5 out of 5 | |
| Otterville High School 7-12 | 105 Students | 19.7 miles away | Not Yet Rated | |
Compare This School To Nearby Schools ->
Navigation
Can't Find What You Are Looking For?
Rankings
Nearby Cities
Sponsored Links
K-12 Articles

It's the Most Wonderful Time of the Year!
For most of the country, school is starting up this week or later this month-at the beginning of...
For most of the country, school is starting up this week or later this month-at the beginning of...

Is Your Child Happy at School?
As a parent, you’d love to have your child share all of his feelings with you. It would be so easy...
As a parent, you’d love to have your child share all of his feelings with you. It would be so easy...

Summer Safety Tips to Keep Kids Safe
It won’t be long until kids run from the school, shrieking in delight because they’re free for the...
It won’t be long until kids run from the school, shrieking in delight because they’re free for the...