Kirbyville Middle School
Rating
Not Available
Not Available

No Reviews Yet
Find Old Friends From Kirbyville Middle School
Use the form below to search for alumni from Kirbyville Middle School.
School Description
School Summary and Highlights
- Enrolls 163 elementary and middle school students from grades 4-8
- Ranks 309th out of 653 middle schools in MO.
- 2010 Overall School AYP Met Status: Not Met
Additional Contact Information
- Mailing Address: 6225 State Hwy 76 E, Kirbyville, MO 65679
- Principal or Admin: Amy Burton
- Fax: (417) 348-0525
- Website: WWW.KIRBYVILLE.K12.MO.US
School Operational Details
- Title I Eligible
School District Details
- Kirbyville R-Vi School District
- Per-Pupil Spending: $8,382
- Students Per Teacher: 11.2
- Enrolled Students: 303
Faculty Details and Student Enrollment
Students and Faculty
- Total Students Enrolled: 163
- Total Full Time "Equivalent" Teachers: 15.4
- Average Student-To-Teacher Ratio: 10.6
Students Gender Breakdown
- Males: 91 (55.8%)
- Females: 72 (44.2%)
Free Lunch Student Eligibility Breakdown
- Eligible for Reduced Lunch: 18 (11.0%)
- Eligible for Free Lunch: 73 (44.8%)
- Eligible for Either Reduced or Free Lunch: 91 (55.8%)
Student Enrollment Distribution by Race / Ethnicity
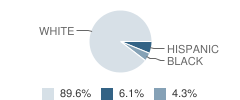
| Number | Percent | |
|---|---|---|
| American Indian | - | - |
| Black | 7 | 4.3% |
| Asian | - | - |
| Hispanic | 10 | 6.1% |
| White | 146 | 89.6% |
Number of Students Per Grade
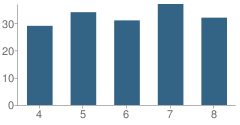
| Number | Percent | |
|---|---|---|
| 4th Grade | 29 | 17.8% |
| 5th Grade | 34 | 20.9% |
| 6th Grade | 31 | 19.0% |
| 7th Grade | 37 | 22.7% |
| 8th Grade | 32 | 19.6% |
Classroom Environment (2010)
Students Per Classroom
School:
13.0
District:
14.0
Faculty Information (2010)
Principal Years of Experience: 11.0
Teacher Average Years of Experience: 9.1
Faculty Salary (2010)
Average Salary of Administration: $50,674
Average Salary of Teachers: $36,116
Teacher Credentials (2009)
Percent of Teachers with Regular Certificates
School:
100.0%
District:
100.0%
Source: MO Department of Education, Source: NCES 2009-2010
School Ratings and Reviews
Be The First To Review Kirbyville Middle School!
School Map and Similar Schools Nearby
Click to Activate Map of Nearby School Campuses
Private
Public
This School
Similar Schools Nearby
| Hollister Junior High School 7-8 | 203 Students | 2.7 miles away | Not Yet Rated | |
| Branson Jr. High School 7-8 | 629 Students | 5.0 miles away | Not Yet Rated | |
| Forsyth Middle School 5-8 | 371 Students | 5.1 miles away | Not Yet Rated | |
| Branson Intermediate School 5-6 | 676 Students | 7.1 miles away | Not Yet Rated | |
| Taneyville Elementary School KG-8 | 209 Students | 9.9 miles away | Not Yet Rated | |
| Reeds Spring Middle School 7-8 | 313 Students | 15.1 miles away | Not Yet Rated | |
| Reeds Spring Intermediate School 5-6 | 291 Students | 15.2 miles away | Not Yet Rated | |
| Blue Eye Middle School 5-8 | 183 Students | 16.2 miles away | Not Yet Rated | |
| Mark Twain Elementary School PK-8 | 67 Students | 16.8 miles away | Not Yet Rated | |
| Bradleyville High School 7-12 | 157 Students | 17.3 miles away |  5 out of 5 | |
Compare This School To Nearby Schools ->
School Community Forum

Join a discussion about Kirbyville Middle School and talk to others in the community including students, parents, teachers, and administrators.
Popular Discussion Topics
- Admissions and Registration Questions (e.g. Dress Code and Discipline Policy)
- School Calendar and Upcoming Events (e.g. Graduation)
- After School Programs, Extracurricular Activities, and Athletics (e.g. Football)
- News and Announcements (e.g. Yearbook and Class Supply List Details)
- Graduate and Alumni Events (e.g. Organizing Class Reunions)
Navigation
Can't Find What You Are Looking For?
Rankings
Nearby Cities
Sponsored Links
K-12 Articles

Promoting Childhood Literacy
The number of American adults who are illiterate is astounding. People who lack the ability to read...
The number of American adults who are illiterate is astounding. People who lack the ability to read...

Teachers Packing Heat
After the recent school shootings (and thwarted school shootings) in the past month-just as after...
After the recent school shootings (and thwarted school shootings) in the past month-just as after...

Strategies to Help Kids Cope with Stress
Many parents believe that kids don't experience stress. Nothing could be further from the truth....
Many parents believe that kids don't experience stress. Nothing could be further from the truth....