Swedeborg Elementary School
Rating
Not Available
Not Available

No Reviews Yet
Find Old Friends From Swedeborg Elementary School
Use the form below to search for alumni from Swedeborg Elementary School.
School Description
School Summary and Highlights
- Enrolls 64 preschool and elementary school students from grades PK-8
- Ranks 455th out of 653 middle schools in MO.
- 2010 Overall School AYP Met Status: Met
Additional Contact Information
- Principal or Admin: Joseph Dunlap
- Fax: (573) 736-5926
- Website: www.swedeborg.k12.mo.us
School Operational Details
- Title I Eligible
School District Details
- Swedeborg R-Iii School District
- Per-Pupil Spending: $11,608
- Students Per Teacher: 8.1
- Enrolled Students: 64
Faculty Details and Student Enrollment
Students and Faculty
- Total Students Enrolled: 64
- Total Full Time "Equivalent" Teachers: 7.9
- Average Student-To-Teacher Ratio: 8.1
Students Gender Breakdown
- Males: 32 (50.0%)
- Females: 32 (50.0%)
Free Lunch Student Eligibility Breakdown
- Eligible for Reduced Lunch: 6 (9.4%)
- Eligible for Free Lunch: 27 (42.2%)
- Eligible for Either Reduced or Free Lunch: 33 (51.6%)
Student Enrollment Distribution by Race / Ethnicity
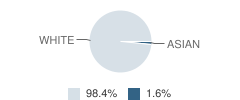
| Number | Percent | |
|---|---|---|
| American Indian | - | - |
| Black | - | - |
| Asian | 1 | 1.6% |
| Hispanic | - | - |
| White | 63 | 98.4% |
Number of Students Per Grade
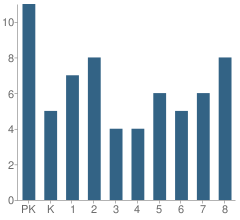
| Number | Percent | |
|---|---|---|
| Pre-Kindergarten | 11 | 17.2% |
| Kindergarten | 5 | 7.8% |
| 1st Grade | 7 | 10.9% |
| 2nd Grade | 8 | 12.5% |
| 3rd Grade | 4 | 6.3% |
| 4th Grade | 4 | 6.3% |
| 5th Grade | 6 | 9.4% |
| 6th Grade | 5 | 7.8% |
| 7th Grade | 6 | 9.4% |
| 8th Grade | 8 | 12.5% |
Classroom Environment (2010)
Students Per Classroom
School:
8.0
District:
8.0
Faculty Information (2010)
Principal Years of Experience: 2.0
Teacher Average Years of Experience: 8.3
Faculty Salary (2010)
Average Salary of Teachers: $27,488
Teacher Credentials (2009)
Percent of Teachers with Regular Certificates
School:
87.5%
District:
100.0%
Percent of Teachers with No Certificate: 12.5%
Source: MO Department of Education, Source: NCES 2009-2010
School Ratings and Reviews
Be The First To Review Swedeborg Elementary School!
School Map and Similar Schools Nearby
Click to Activate Map of Nearby School Campuses
Private
Public
This School
Similar Schools Nearby
| Richland Elementary School KG-6 | 334 Students | 4.7 miles away | Not Yet Rated | |
| Crocker Elementary School PK-6 | 333 Students | 5.2 miles away | Not Yet Rated | |
| Waynesville East Elementary School PK-2 | 1,044 Students | 9.7 miles away | Not Yet Rated | - |
| Laquey R-V Elementary School PK-5 | 317 Students | 10.5 miles away | Not Yet Rated | |
| Stoutland Elementary School PK-6 | 249 Students | 11.9 miles away | Not Yet Rated | |
| Iberia Elementary School PK-6 | 404 Students | 12.5 miles away |  4 out of 5 | |
| Wood Elementary School KG-6 | 307 Students | 13.4 miles away | Not Yet Rated | |
| Dixon Elementary School PK-5 | 521 Students | 14.1 miles away |  3 out of 5 | |
| Partridge Elementary School KG-5 | 346 Students | 14.1 miles away |  5 out of 5 | |
| Pick Elementary School KG-5 | 302 Students | 15.4 miles away | 5 out of 5 | |
Compare This School To Nearby Schools ->
Navigation
Can't Find What You Are Looking For?
Rankings
Nearby Cities
Sponsored Links
K-12 Articles

Everyone Loves Going to the Doctor and Dentist
Going to the doctor or dentist can be traumatic for children of all ages. Many adults do not...
Going to the doctor or dentist can be traumatic for children of all ages. Many adults do not...

Helping Your Learning Disabled Child
Thousands of children in America struggle to learn on a daily basis. Many of them have invisible...
Thousands of children in America struggle to learn on a daily basis. Many of them have invisible...

Imho
I was watching Headline News's news ticker when I read something that made me LOL. The ticker said...
I was watching Headline News's news ticker when I read something that made me LOL. The ticker said...