Vasquez High School
Rating
Not Available
Not Available

2.5 out of 5 | 8 Reviews
Find Old Friends From Vasquez High School
Use the form below to search for alumni from Vasquez High School.
School Description
School Summary and Highlights
- Enrolls 609 high school students from grades 9-12
- Ranks 1051st out of 1,197 high schools in CA.
- 2010 Overall School AYP Met Status: No
Additional Contact Information
- Mailing Address: 33630 Red Rover Mine Rd., Acton, CA 93510
School District Details
- Acton-Agua Dulce Unified School District
- Per-Pupil Spending: $7,360
- Graduation Rate: 75.4%
- Students Per Teacher: 22.3
- Enrolled Students: 1,795
Faculty Details and Student Enrollment
Students and Faculty
- Total Students Enrolled: 609
- Total Full Time "Equivalent" Teachers: 26.0
- Average Student-To-Teacher Ratio: 23.4
Students Gender Breakdown
- Males: 321 (52.7%)
- Females: 288 (47.3%)
Free Lunch Student Eligibility Breakdown
- Eligible for Reduced Lunch: 23 (3.8%)
- Eligible for Free Lunch: 98 (16.1%)
- Eligible for Either Reduced or Free Lunch: 121 (19.9%)
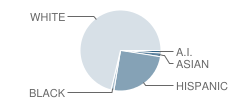
Student Enrollment Distribution by Race / Ethnicity
| Number | Percent | |
|---|---|---|
| American Indian | 6 | 1.0% |
| Black | 7 | 1.1% |
| Asian | 9 | 1.5% |
| Hispanic | 152 | 25.0% |
| White | 431 | 70.8% |
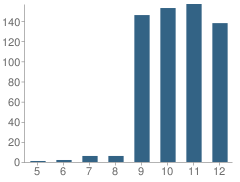
Number of Students Per Grade
| Number | Percent | |
|---|---|---|
| 5th Grade | 1 | 0.2% |
| 6th Grade | 2 | 0.3% |
| 7th Grade | 6 | 1.0% |
| 8th Grade | 6 | 1.0% |
| 9th Grade | 146 | 24.0% |
| 10th Grade | 153 | 25.1% |
| 11th Grade | 157 | 25.8% |
| 12th Grade | 138 | 22.7% |
Graduates Information (2010)
Graduation Rate
School:
92.0%
District:
92.0%
State:
78.6%
Teacher Education Background (2009)
Percent With Master's Degree: 10.3%
Percent With Bachelor's Degree: 20.7%
Teacher Credentials & Experience (2009)
Percent of Teachers With Emergency Credentials: 11.5%
Percent of Teachers With Credentials: 76.9%
Number of Certificated Staff: 29.0
Average Number of Years of Teacher Experience: 6.8
Average Age
School:
39.8
District:
58.0
Source: CA Department of Education, Source: NCES 2009-2010
School Ratings and Reviews
Overall Rating: 2.5

2.5 out of 5 | 8 Reviews
The Overall Rating is the school's average rating from parents, students, school faculty and staff. The highest rating is five apples and the lowest is one apple.
Share Your Review About This School
8 reviews for Vasquez High School
- Reviewed by Student on November 09, 2011
- Rating:
 (1 / 5) Flag as inappropriate
 - vhs is the worst high school you could go to. i am going from 2011-2015 and it sucks. the teachers don't teach anything. the grades are unfair. just go somewhere else. it sucks
- Reviewed by Community Member on November 13, 2010
- Rating: (1 / 5) Flag as inappropriate
- I am not to sure about this school, personally I have never attended it. I have a cousin who is using the virtual online classes/homeschooling and the work she turns in doesn't get graded often.. how is she to excel in moving up a grade if no one is checking and grading her work.. isnt it the schools job to make sure their students goals get reached? The school won't even allow the student to go back to classes due to a harsh record of fighting.. well gee if the teachers were paying attention to the needs of the students the fighting might not occur and she would be in class doing the work assigned.. and not struggleing to make it on her own in homeschooling with no support from the school educators!!
- Reviewed by Former Student on November 11, 2009
- Rating: (1 / 5) Flag as inappropriate
- This school is as bad as it looks, almost a decade into "constructing" a permanent high school it still proves to be insufficient and cannot manage funds well. Speaking as a student who attended 2002-2006, I would NEVER recommend this school as an option to parents, and if so, hire a personal college counselor because the school does not offer such assistance from a professional. Vasquez might be semi-decent if your child is involved in football, but again, half the faculty are underqualified for their positions (hence the current problems) and endless internal disagreements plague this school.
- Reviewed by Parent/Guardian on September 28, 2009
- Rating:
 (5 / 5) Flag as inappropriate
 - I am very concerned about this school as I am moving to the area but have not heard good things about this school - from people who live in Acton who drive their kids to Santa Clarita and Also from Teachers and Santa Clarita residence. I'm very concerned and think I should cancel my escrow - not a good report card. There is so much money in this area why is the school lacking? Terrible about the suicide last year, this should have been avoided and the school should be held responsible.
- Reviewed by Student on August 04, 2009
- Rating:
 (2 / 5) Flag as inappropriate
 - this school sucks theres so many teachers that don't teach us anything and don't really care what we do. the only good thing about it is everyone knows everyone and some of the people are nice
- Reviewed by Student on March 05, 2009
- Rating: (1 / 5) Flag as inappropriate
- youre school sucks i was treated so unfairly there , not only by students but also by its teachers!
- Reviewed by Student on January 28, 2009
- Rating: (5 / 5) Flag as inappropriate
- love this school. CLASS OF 2009
- Reviewed by Former Student on October 20, 2008
- Rating: (5 / 5) Flag as inappropriate
- good school, great environment, good teachers
Read All 8 Reviews ->
School Map and Similar Schools Nearby
Click to Activate Map of Nearby School Campuses
Private
Public
This School
Similar Schools Nearby
| Highland High School 9-12 | 2,960 Students | 6.9 miles away |  3 out of 5 | |
| Palmdale High School 9-12 | 3,285 Students | 9.1 miles away | 3 out of 5 | |
| Quartz Hill High School 9-12 | 3,118 Students | 11.7 miles away | Not Yet Rated | |
| William J. 'pete' Knight High School 9-12 | 3,450 Students | 12.9 miles away |  5 out of 5 | |
| Lancaster High School 9-12 | 2,751 Students | 14.1 miles away | 3 out of 5 | |
| Antelope Valley High School 9-12 | 1,772 Students | 15.2 miles away |  4.5 out of 5 | |
| Eastside High School 9-12 | 2,527 Students | 15.6 miles away |  3.5 out of 5 | |
| Littlerock High School 9-12 | 1,795 Students | 17.1 miles away | 5 out of 5 | |
| Rosamond High School 9-12 | 921 Students | 25.8 miles away | 5 out of 5 | |
Compare This School To Nearby Schools ->
School Community Forum

Join a discussion about Vasquez High School and talk to others in the community including students, parents, teachers, and administrators.
Popular Discussion Topics
- Admissions and Registration Questions (e.g. Dress Code and Discipline Policy)
- School Calendar and Upcoming Events (e.g. Graduation)
- After School Programs, Extracurricular Activities, and Athletics (e.g. Football)
- News and Announcements (e.g. Yearbook and Class Supply List Details)
- Graduate and Alumni Events (e.g. Organizing Class Reunions)
Navigation
Can't Find What You Are Looking For?
Rankings
Nearby Cities
Sponsored Links
K-12 Articles

Bullycide: What is It and How Can It Be Prevented?
Disclaimer: This article expresses my opinion that has been formed by personal experience and...
Disclaimer: This article expresses my opinion that has been formed by personal experience and...

Bullies... What Are They Good For?
Bullies have been around since the beginning of time. We had to deal with bullies, and our parents...
Bullies have been around since the beginning of time. We had to deal with bullies, and our parents...

Cut the Credit and Save You Some Money
Today's society glorifies a get-it-now mentality. Children learn this early. You probably noticed...
Today's society glorifies a get-it-now mentality. Children learn this early. You probably noticed...