Cuyama Elementary School
Rating
Not Available
Not Available

No Reviews Yet
Find Old Friends From Cuyama Elementary School
Use the form below to search for alumni from Cuyama Elementary School.
School Description
School Summary and Highlights
- Enrolls 184 elementary school students from grades KG-8
- Ranks 1513th out of 2,050 middle schools in CA.
- 2010 Overall School AYP Met Status: No
Additional Contact Information
- Mailing Address: PO Box 271, New Cuyama, CA 93254
School Operational Details
- Title I Eligible
School District Details
- Cuyama Joint Unified School District
- Per-Pupil Spending: $11,520
- Graduation Rate: 95.0%
- Students Per Teacher: 16.8
- Enrolled Students: 261
Faculty Details and Student Enrollment
Students and Faculty
- Total Students Enrolled: 184
- Total Full Time "Equivalent" Teachers: 8.0
- Average Student-To-Teacher Ratio: 23.0
Students Gender Breakdown
- Males: 89 (48.4%)
- Females: 95 (51.6%)
Free Lunch Student Eligibility Breakdown
- Eligible for Reduced Lunch: 21 (11.4%)
- Eligible for Free Lunch: 145 (78.8%)
- Eligible for Either Reduced or Free Lunch: 166 (90.2%)
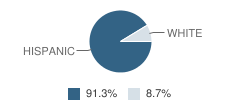
Student Enrollment Distribution by Race / Ethnicity
| Number | Percent | |
|---|---|---|
| American Indian | - | - |
| Black | - | - |
| Asian | - | - |
| Hispanic | 21 | 11.4% |
| White | 2 | 1.1% |
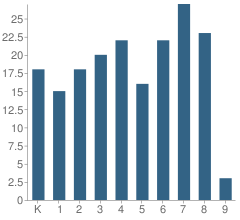
Number of Students Per Grade
| Number | Percent | |
|---|---|---|
| Kindergarten | 18 | 9.8% |
| 1st Grade | 15 | 8.2% |
| 2nd Grade | 18 | 9.8% |
| 3rd Grade | 20 | 10.9% |
| 4th Grade | 22 | 12.0% |
| 5th Grade | 16 | 8.7% |
| 6th Grade | 22 | 12.0% |
| 7th Grade | 27 | 14.7% |
| 8th Grade | 23 | 12.5% |
| 9th Grade | 3 | 1.6% |
Teacher Education Background (2009)
Percent With Master's Degree: 18.2%
Percent With Bachelor's Degree: 9.1%
Teacher Credentials & Experience (2009)
Percent of Teachers With Credentials: 100.0%
Number of Certificated Staff: 11.0
Average Number of Years of Teacher Experience: 13.4
Average Age: 48.0
Source: CA Department of Education, Source: NCES 2009-2010
School Ratings and Reviews
Be The First To Review Cuyama Elementary School!
School Map and Similar Schools Nearby
Click to Activate Map of Nearby School Campuses
Private
Public
This School
Similar Schools Nearby
| Maricopa Elementary School KG-8 | 203 Students | 14.4 miles away | Not Yet Rated | |
| Conley Elementary School KG-3 | 248 Students | 16.1 miles away | Not Yet Rated | |
| Parkview Elementary School KG-3 | 303 Students | 16.1 miles away | Not Yet Rated | |
| Midway Elementary School KG-8 | 65 Students | 17.0 miles away | Not Yet Rated | - |
| Taft Primary School KG-5 | 200 Students | 17.1 miles away | Not Yet Rated | |
| Roosevelt Elementary School 4-5 | 469 Students | 17.1 miles away | Not Yet Rated | |
| Jefferson Elementary School KG-3 | 175 Students | 17.6 miles away |  5 out of 5 | |
| Mckittrick Elementary School KG-8 | 72 Students | 25.6 miles away | Not Yet Rated | |
| Elk Hills Elementary School KG-8 | 81 Students | 29.1 miles away | Not Yet Rated | |
Compare This School To Nearby Schools ->
School Community Forum

Join a discussion about Cuyama Elementary School and talk to others in the community including students, parents, teachers, and administrators.
Popular Discussion Topics
- Admissions and Registration Questions (e.g. Dress Code and Discipline Policy)
- School Calendar and Upcoming Events (e.g. Graduation)
- After School Programs, Extracurricular Activities, and Athletics (e.g. Football)
- News and Announcements (e.g. Yearbook and Class Supply List Details)
- Graduate and Alumni Events (e.g. Organizing Class Reunions)
Navigation
Can't Find What You Are Looking For?
Rankings
Nearby Cities
Sponsored Links
K-12 Articles

Teaching Your Child Study Skills
Many children who have the capability to get good grades experience frustration because of low...
Many children who have the capability to get good grades experience frustration because of low...
Homework Tips: Taking the Work out of Homework
Kids hate homework. It seems that almost every night of the week they are overloaded with...
Kids hate homework. It seems that almost every night of the week they are overloaded with...

The Very Best Things in the World
A recent poll in the U.K. revealed that children view the “very best thing in the world” as being...
A recent poll in the U.K. revealed that children view the “very best thing in the world” as being...