Juniper Elementary School
Rating
Not Available
Not Available

5 out of 5 | 1 Review
Find Old Friends From Juniper Elementary School
Use the form below to search for alumni from Juniper Elementary School.
School Description
School Summary and Highlights
- Enrolls 670 elementary school students from grades KG-6
- Ranks 2334th out of 5,423 elementary schools in CA.
- 2010 Overall School AYP Met Status: No
Additional Contact Information
- Mailing Address: 9400 I Ave., Hesperia, CA 92345
School Operational Details
- Title I EligibleAll students of this school are eligible for participation in authorized programs.
School District Details
- Hesperia Unified School District
- Per-Pupil Spending: $7,795
- Graduation Rate: 74.7%
- Dropout Rate: 4.8%
- Students Per Teacher: 26.6
- Enrolled Students: 22,821
Faculty Details and Student Enrollment
Students and Faculty
- Total Students Enrolled: 670
- Total Full Time "Equivalent" Teachers: 23.0
- Average Student-To-Teacher Ratio: 29.1
Students Gender Breakdown
- Males: 336 (50.1%)
- Females: 334 (49.9%)
Free Lunch Student Eligibility Breakdown
- Eligible for Reduced Lunch: 67 (10.0%)
- Eligible for Free Lunch: 424 (63.3%)
- Eligible for Either Reduced or Free Lunch: 491 (73.3%)
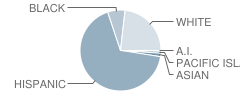
Student Enrollment Distribution by Race / Ethnicity
| Number | Percent | |
|---|---|---|
| American Indian | 3 | 0.4% |
| Black | 47 | 7.0% |
| Asian | 10 | 1.5% |
| Hispanic | 449 | 67.0% |
| White | 155 | 23.1% |
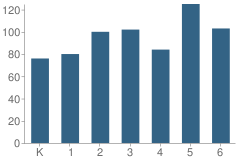
Number of Students Per Grade
| Number | Percent | |
|---|---|---|
| Kindergarten | 76 | 11.3% |
| 1st Grade | 80 | 11.9% |
| 2nd Grade | 100 | 14.9% |
| 3rd Grade | 102 | 15.2% |
| 4th Grade | 84 | 12.5% |
| 5th Grade | 125 | 18.7% |
| 6th Grade | 103 | 15.4% |
Teacher Education Background (2009)
Percent With Master's Degree
School:
43.2%
District:
51.1%
Percent With Bachelor's Degree
School:
8.1%
District:
10.6%
Teacher Credentials & Experience (2009)
Percent of Teachers With Emergency Credentials: 2.9%
Percent of Teachers With Credentials: 94.3%
Number of Certificated Staff: 37.0
Average Number of Years of Teacher Experience: 13.6
Average Age
School:
44.4
District:
44.9
Source: CA Department of Education, Source: NCES 2009-2010
School Ratings and Reviews
Overall Rating: 5

5 out of 5 | 1 Review
The Overall Rating is the school's average rating from parents, students, school faculty and staff. The highest rating is five apples and the lowest is one apple.
Share Your Review About This School
1 review for Juniper Elementary School
- Reviewed by Parent/Guardian on March 04, 2010
- Rating:
 (5 / 5) Flag as inappropriate
 - It has been a great experience for my k
student
School Map and Similar Schools Nearby
Click to Activate Map of Nearby School Campuses
Private
Public
This School
Similar Schools Nearby
| Lime Street Elementary School KG-6 | 802 Students | 1.5 miles away |  2 out of 5 | |
| Mesa Grande Elementary School KG-6 | 676 Students | 1.5 miles away |  5 out of 5 | |
| Joshua Circle Elementary School KG-6 | 778 Students | 2.1 miles away | Not Yet Rated | |
| Carmel Elementary School KG-6 | 691 Students | 2.3 miles away | 5 out of 5 | |
| Kingston Elementary School KG-6 | 790 Students | 2.5 miles away | 5 out of 5 | |
| Cypress Academy KG-6 | 641 Students | 2.7 miles away | Not Yet Rated | |
| Eucalyptus Elementary School KG-6 | 661 Students | 2.7 miles away |  4 out of 5 | |
| Krystal School of Science, Math & Technology KG-6 | 635 Students | 3.1 miles away | Not Yet Rated | - |
| Cottonwood Elementary School KG-6 | 920 Students | 3.3 miles away |  3 out of 5 | |
| Maple Elementary School KG-6 | 607 Students | 4.0 miles away | 5 out of 5 | |
Compare This School To Nearby Schools ->
School Community Forum

Join a discussion about Juniper Elementary School and talk to others in the community including students, parents, teachers, and administrators.
Popular Discussion Topics
- Admissions and Registration Questions (e.g. Dress Code and Discipline Policy)
- School Calendar and Upcoming Events (e.g. Graduation)
- After School Programs, Extracurricular Activities, and Athletics (e.g. Football)
- News and Announcements (e.g. Yearbook and Class Supply List Details)
- Graduate and Alumni Events (e.g. Organizing Class Reunions)
Navigation
Can't Find What You Are Looking For?
Rankings
Nearby Cities
Sponsored Links
K-12 Articles

Imho
I was watching Headline News's news ticker when I read something that made me LOL. The ticker said...
I was watching Headline News's news ticker when I read something that made me LOL. The ticker said...

The Pros and Cons of Seat Belts in School Buses
Recently the news has been full of school bus accidents where children have been seriously injured...
Recently the news has been full of school bus accidents where children have been seriously injured...

Teaching Your Kids About Respect, Values and Violence
These days it seems that every newscast reports at least once incident of violence. As parents, we...
These days it seems that every newscast reports at least once incident of violence. As parents, we...