Temecula Valley High School

5 out of 5 | 1 Review
Find Old Friends From Temecula Valley High School
Use the form below to search for alumni from Temecula Valley High School.
School Description
School Summary and Highlights
- Enrolls 2,807 high school students from grades 9-12
- Ranks 294th out of 1,197 high schools in CA.
- 2010 Overall School AYP Met Status: No
Additional Contact Information
- Mailing Address: 31555 Rancho Vista Rd., Temecula, CA 92592
School District Details
- Temecula Valley Unified School District
- Per-Pupil Spending: $7,717
- Graduation Rate: 90.4%
- Dropout Rate: 1.6%
- Students Per Teacher: 22.4
- Enrolled Students: 30,139
Faculty Details and Student Enrollment
Students and Faculty
- Total Students Enrolled: 2,807
- Total Full Time "Equivalent" Teachers: 115.4
- Average Student-To-Teacher Ratio: 24.3
Students Gender Breakdown
- Males: 1,422 (50.7%)
- Females: 1,385 (49.3%)
Free Lunch Student Eligibility Breakdown
- Eligible for Reduced Lunch: 114 (4.1%)
- Eligible for Free Lunch: 245 (8.7%)
- Eligible for Either Reduced or Free Lunch: 359 (12.8%)
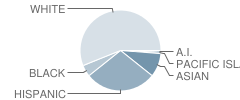
Student Enrollment Distribution by Race / Ethnicity

| Number | Percent | |
|---|---|---|
| American Indian | 24 | 0.9% |
| Black | 130 | 4.6% |
| Asian | 260 | 9.3% |
| Hispanic | 768 | 27.4% |
| White | 1,503 | 53.5% |
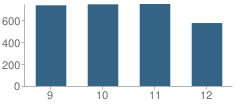
Number of Students Per Grade

| Number | Percent | |
|---|---|---|
| 9th Grade | 737 | 26.3% |
| 10th Grade | 746 | 26.6% |
| 11th Grade | 749 | 26.7% |
| 12th Grade | 575 | 20.5% |
Graduates Information (2010)
Graduation Rate
School:
91.6%
District:
92.7%
State:
78.6%
Teacher Education Background (2009)
Percent With Ph.D.
School:
74.6%
District:
3.4%
Percent With Master's Degree
School:
44.8%
District:
31.0%
Percent With Bachelor's Degree: 1.5%
Teacher Credentials & Experience (2009)
Percent of Teachers With Credentials: 95.8%
Number of Certificated Staff: 134.0
Average Number of Years of Teacher Experience: 16.4
Average Age
School:
44.3
District:
45.4
Source: CA Department of Education, Source: NCES 2009-2010
Sponsored Links
Test Scores and Performance Information
Overall School Rating
How is this determined?
The overall school rating shows that Temecula Valley High School performed on average better than many other schools across the state on CST state exams in the following subjects:
- CST Algebra I
- CST Algebra II
- CST Biology
- CST Chemistry
- CST Earth Science
- CST English-Language Arts
- CST General Mathematics
- CST Geometry
- CST Integrated Math 1
- CST Integrated Math 2
- CST Integrated/Coordinated Science
- CST Physics
- CST Science
- CST Summative High School Math
- CST U.S. History
- CST World History
AYP Results (2010)
Overall AYP Met: No
ELA AYP Met: No
Math AYP Met: No
ACT Exam Results (2009)
Percent of Students Taking ACT Exam: 8.3%
Average Combined Score: 22.7
Percent Scoring At or Above 21: 69.8%
SAT Exam Results (2009)
Percent of Students Taking SAT Exam: 41.5%
Average Combined Score: 1,497.9
Critical Reading Average: 496.9
Math Average: 509.1
Writing Average: 491.8
Percent Scoring At or Above 1500: 50.6%
CST - Test Proficiency by Grade and Subject
Grade 9 - % of students at or above proficiency
| School | District | State | |
|---|---|---|---|
| CST Algebra I Test | |||
| 2010 | 30.0% | 35.0% | 22.0% |
| 2009 | 31.0% | 33.0% | 21.0% |
| 2008 | 31.0% | 30.0% | 18.0% |
| CST Algebra II Test | |||
| 2010 | 65.0% | 78.0% | 69.0% |
| 2009 | 70.0% | 69.0% | 65.0% |
| 2008 | 46.0% | 69.0% | 66.0% |
| CST Biology Test | |||
| 2010 | 66.0% | 71.0% | 55.0% |
| 2009 | 67.0% | 67.0% | 51.0% |
| 2008 | 71.0% | 73.0% | 52.0% |
| CST Chemistry Test | |||
| 2010 | 100.0% | 92.0% | 49.0% |
| CST English-Language Arts Test | |||
| 2010 | 75.0% | 79.0% | 54.0% |
| 2009 | 70.0% | 71.0% | 50.0% |
| 2008 | 64.0% | 68.0% | 49.0% |
| CST Geometry Test | |||
| 2010 | 56.0% | 51.0% | 46.0% |
| 2009 | 63.0% | 53.0% | 47.0% |
| 2008 | 66.0% | 55.0% | 43.0% |
| CST Integrated/Coordinated Science Test | |||
| 2010 | 43.0% | 45.0% | 19.0% |
| 2009 | 25.0% | 39.0% | 15.0% |
| 2008 | 17.0% | 35.0% | 5.0% |
| CST World History Test | |||
| 2010 | 39.0% | 37.0% | 45.0% |
| 2009 | 44.0% | 43.0% | 41.0% |
| 2008 | 32.0% | 31.0% | 36.0% |
| CST General Mathematics Test | |||
| 2009 | 5.0% | 24.0% | 17.0% |
| 2008 | 4.0% | 20.0% | 18.0% |
| CST Integrated Math 1 Test | |||
| 2009 | 52.0% | 38.0% | 26.0% |
| 2008 | 47.0% | 45.0% | 15.0% |
Grade 10 - % of students at or above proficiency
| School | District | State | |
|---|---|---|---|
| CST Algebra I Test | |||
| 2010 | 13.0% | 18.0% | 12.0% |
| 2009 | 9.0% | 8.0% | 11.0% |
| 2008 | 12.0% | 11.0% | 9.0% |
| CST Algebra II Test | |||
| 2010 | 22.0% | 37.0% | 40.0% |
| 2009 | 33.0% | 36.0% | 37.0% |
| 2008 | 26.0% | 34.0% | 36.0% |
| CST Biology Test | |||
| 2010 | 40.0% | 61.0% | 38.0% |
| 2009 | 45.0% | 54.0% | 34.0% |
| 2008 | 52.0% | 55.0% | 35.0% |
| CST Chemistry Test | |||
| 2010 | 49.0% | 54.0% | 47.0% |
| 2009 | 36.0% | 46.0% | 44.0% |
| 2008 | 42.0% | 49.0% | 41.0% |
| CST Earth Science Test | |||
| 2010 | 38.0% | 42.0% | 29.0% |
| CST English-Language Arts Test | |||
| 2010 | 58.0% | 62.0% | 45.0% |
| 2009 | 54.0% | 55.0% | 44.0% |
| 2008 | 50.0% | 54.0% | 41.0% |
| CST Geometry Test | |||
| 2010 | 23.0% | 21.0% | 14.0% |
| 2009 | 21.0% | 20.0% | 14.0% |
| 2008 | 21.0% | 19.0% | 12.0% |
| CST Integrated Math 1 Test | |||
| 2010 | 8.0% | 14.0% | 11.0% |
| 2009 | 17.0% | 12.0% | 9.0% |
| 2008 | 16.0% | 24.0% | 10.0% |
| CST Integrated/Coordinated Science Test | |||
| 2010 | 52.0% | 31.0% | 14.0% |
| CST Physics Test | |||
| 2010 | 73.0% | 70.0% | 44.0% |
| CST Science Test | |||
| 2010 | 63.0% | 67.0% | 46.0% |
| 2009 | 59.0% | 59.0% | 44.0% |
| 2008 | 56.0% | 56.0% | 40.0% |
| CST Summative High School Math Test | |||
| 2010 | 69.0% | 63.0% | 75.0% |
| 2009 | 69.0% | 72.0% | 71.0% |
| 2008 | 65.0% | 70.0% | 68.0% |
| CST World History Test | |||
| 2010 | 54.0% | 56.0% | 42.0% |
| 2009 | 50.0% | 50.0% | 38.0% |
| 2008 | 49.0% | 49.0% | 33.0% |
Grade 11 - % of students at or above proficiency
| School | District | State | |
|---|---|---|---|
| CST Algebra I Test | |||
| 2010 | 17.0% | 12.0% | 8.0% |
| 2009 | 6.0% | 5.0% | 8.0% |
| 2008 | 8.0% | 8.0% | 5.0% |
| CST Algebra II Test | |||
| 2010 | 7.0% | 13.0% | 14.0% |
| 2009 | 9.0% | 12.0% | 12.0% |
| 2008 | 5.0% | 9.0% | 11.0% |
| CST Biology Test | |||
| 2010 | 66.0% | 51.0% | 46.0% |
| 2009 | 59.0% | 47.0% | 41.0% |
| 2008 | 49.0% | 38.0% | 39.0% |
| CST Chemistry Test | |||
| 2010 | 36.0% | 50.0% | 30.0% |
| 2009 | 36.0% | 44.0% | 27.0% |
| 2008 | 23.0% | 40.0% | 25.0% |
| CST Earth Science Test | |||
| 2010 | 62.0% | 54.0% | 32.0% |
| 2009 | 59.0% | 54.0% | 26.0% |
| 2008 | 30.0% | 30.0% | 28.0% |
| CST English-Language Arts Test | |||
| 2010 | 54.0% | 56.0% | 42.0% |
| 2009 | 51.0% | 51.0% | 40.0% |
| 2008 | 47.0% | 48.0% | 37.0% |
| CST Geometry Test | |||
| 2010 | 15.0% | 13.0% | 6.0% |
| 2009 | 15.0% | 12.0% | 7.0% |
| 2008 | 7.0% | 10.0% | 6.0% |
| CST Integrated Math 1 Test | |||
| 2010 | 5.0% | 8.0% | 11.0% |
| 2009 | 17.0% | 11.0% | 9.0% |
| 2008 | 10.0% | 12.0% | 9.0% |
| CST Integrated Math 2 Test | |||
| 2010 | 21.0% | 20.0% | 19.0% |
| 2009 | 14.0% | 25.0% | 15.0% |
| 2008 | 13.0% | 26.0% | 13.0% |
| CST Physics Test | |||
| 2010 | 68.0% | 66.0% | 53.0% |
| 2009 | 67.0% | 56.0% | 50.0% |
| 2008 | 79.0% | 70.0% | 47.0% |
| CST Summative High School Math Test | |||
| 2010 | 37.0% | 45.0% | 50.0% |
| 2009 | 32.0% | 41.0% | 47.0% |
| 2008 | 32.0% | 38.0% | 43.0% |
| CST U.S. History Test | |||
| 2010 | 59.0% | 60.0% | 45.0% |
| 2009 | 64.0% | 62.0% | 44.0% |
| 2008 | 51.0% | 52.0% | 38.0% |
| CST Integrated/Coordinated Science Test | |||
| 2009 | 54.0% | 33.0% | 11.0% |
End of Course - % of students at or above proficiency
| School | District | State | |
|---|---|---|---|
| CST Algebra I Test | |||
| 2010 | 27.0% | 47.0% | 31.0% |
| 2009 | 25.0% | 45.0% | 28.0% |
| 2008 | 26.0% | 41.0% | 25.0% |
| CST Algebra II Test | |||
| 2010 | 18.0% | 33.0% | 31.0% |
| 2009 | 26.0% | 31.0% | 28.0% |
| 2008 | 17.0% | 29.0% | 27.0% |
| CST Biology Test | |||
| 2010 | 61.0% | 63.0% | 46.0% |
| 2009 | 60.0% | 57.0% | 42.0% |
| 2008 | 61.0% | 58.0% | 42.0% |
| CST Chemistry Test | |||
| 2010 | 47.0% | 57.0% | 38.0% |
| 2009 | 37.0% | 47.0% | 36.0% |
| 2008 | 32.0% | 45.0% | 32.0% |
| CST Earth Science Test | |||
| 2010 | 55.0% | 51.0% | 33.0% |
| 2009 | 56.0% | 50.0% | 28.0% |
| 2008 | 29.0% | 29.0% | 28.0% |
| CST Geometry Test | |||
| 2010 | 34.0% | 41.0% | 27.0% |
| 2009 | 34.0% | 38.0% | 26.0% |
| 2008 | 36.0% | 37.0% | 24.0% |
| CST Integrated Math 1 Test | |||
| 2010 | 8.0% | 13.0% | 13.0% |
| 2009 | 21.0% | 14.0% | 11.0% |
| 2008 | 18.0% | 19.0% | 11.0% |
| CST Integrated Math 2 Test | |||
| 2010 | 25.0% | 23.0% | 27.0% |
| 2009 | 14.0% | 26.0% | 25.0% |
| 2008 | 12.0% | 26.0% | 25.0% |
| CST Integrated/Coordinated Science Test | |||
| 2010 | 46.0% | 43.0% | 16.0% |
| 2009 | 33.0% | 36.0% | 13.0% |
| 2008 | 17.0% | 33.0% | 11.0% |
| CST Physics Test | |||
| 2010 | 68.0% | 66.0% | 49.0% |
| 2009 | 67.0% | 54.0% | 46.0% |
| 2008 | 81.0% | 72.0% | 43.0% |
| CST Summative High School Math Test | |||
| 2010 | 44.0% | 49.0% | 54.0% |
| 2009 | 39.0% | 49.0% | 50.0% |
| 2008 | 38.0% | 44.0% | 47.0% |
| CST World History Test | |||
| 2010 | 52.0% | 55.0% | 41.0% |
| 2009 | 48.0% | 50.0% | 38.0% |
| 2008 | 47.0% | 49.0% | 33.0% |
| CST General Mathematics Test | |||
| 2009 | 5.0% | 46.0% | 26.0% |
| 2008 | 4.0% | 45.0% | 27.0% |
Source: CA Department of Education 2009-2010
School Map and Similar Schools Nearby
Click to Activate Map of Nearby School Campuses
Private
Public
This School
Similar Schools Nearby
| Chaparral High School 9-12 | 3,121 Students | 3.0 miles away | Not Yet Rated | |
| Great Oak High School 9-12 | 3,296 Students | 3.8 miles away | ![]() 5 out of 5 | |
| Murrieta Mesa High School 9-12 | 1,112 Students | 6.5 miles away | Not Yet Rated | - |
| Vista Murrieta High School 9-12 | 3,388 Students | 7.4 miles away | ![]() 5 out of 5 | |
| Murrieta Valley High School 9-12 | 2,695 Students | 7.9 miles away | ![]() 3.5 out of 5 | |
| Paloma Valley High School 9-12 | 2,717 Students | 12.0 miles away | ![]() 3 out of 5 | |
| Elsinore High School 9-12 | 2,356 Students | 12.6 miles away | ![]() 3 out of 5 | |
| Fallbrook High School 9-12 | 2,790 Students | 12.9 miles away | Not Yet Rated | |
| Valley Center High School 9-12 | 1,359 Students | 16.2 miles away | ![]() 4 out of 5 | |
| West Valley High School 9-12 | 1,896 Students | 16.3 miles away | Not Yet Rated | |
Compare This School To Nearby Schools ->
School Community Forum

Join a discussion about Temecula Valley High School and talk to others in the community including students, parents, teachers, and administrators.
Popular Discussion Topics
- Admissions and Registration Questions (e.g. Dress Code and Discipline Policy)
- School Calendar and Upcoming Events (e.g. Graduation)
- After School Programs, Extracurricular Activities, and Athletics (e.g. Football)
- News and Announcements (e.g. Yearbook and Class Supply List Details)
- Graduate and Alumni Events (e.g. Organizing Class Reunions)
Navigation
Can't Find What You Are Looking For?
Rankings
Nearby Cities
Sponsored Links
K-12 Articles
Imho
I was watching Headline News's news ticker when I read something that made me LOL. The ticker said...
Promoting Childhood Literacy
The number of American adults who are illiterate is astounding. People who lack the ability to read...
Is Your Child Happy at School?
As a parent, you'd love to have your child share all of his feelings with you. It would be so easy...


(5 / 5) 


