Earle E. Williams Middle School
Rating
Not Available
Not Available

No Reviews Yet
Find Old Friends From Earle E. Williams Middle School
Use the form below to search for alumni from Earle E. Williams Middle School.
School Description
School Summary and Highlights
- Enrolls 1,257 middle school students from grades 6-8
- Ranks 1196th out of 2,050 middle schools in CA.
- 2010 Overall School AYP Met Status: No
Additional Contact Information
- Mailing Address: 1975 West Lowell Ave., Tracy, CA 95376
- Fax: (209) 830-3346
School District Details
- Tracy Joint Unified School District
- Per-Pupil Spending: $7,797
- Graduation Rate: 78.8%
- Dropout Rate: 3.4%
- Students Per Teacher: 21.4
- Enrolled Students: 17,509
Faculty Details and Student Enrollment
Students and Faculty
- Total Students Enrolled: 1,257
- Total Full Time "Equivalent" Teachers: 59.0
- Average Student-To-Teacher Ratio: 21.3
Students Gender Breakdown
- Males: 636 (50.6%)
- Females: 621 (49.4%)
Free Lunch Student Eligibility Breakdown
- Eligible for Reduced Lunch: 107 (8.5%)
- Eligible for Free Lunch: 455 (36.2%)
- Eligible for Either Reduced or Free Lunch: 562 (44.7%)
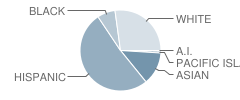
Student Enrollment Distribution by Race / Ethnicity
| Number | Percent | |
|---|---|---|
| American Indian | 5 | 0.4% |
| Black | 87 | 6.9% |
| Asian | 158 | 12.6% |
| Hispanic | 614 | 48.8% |
| White | 325 | 25.9% |
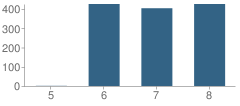
Number of Students Per Grade
| Number | Percent | |
|---|---|---|
| 5th Grade | 1 | 0.08% |
| 6th Grade | 426 | 33.9% |
| 7th Grade | 404 | 32.1% |
| 8th Grade | 426 | 33.9% |
Teacher Education Background (2009)
Percent With Master's Degree
School:
22.9%
District:
55.6%
Percent With Bachelor's Degree
School:
15.7%
District:
2.2%
Teacher Credentials & Experience (2009)
Percent of Teachers With Emergency Credentials: 1.6%
Percent of Teachers With Credentials: 89.1%
Number of Certificated Staff: 70.0
Average Number of Years of Teacher Experience: 11.0
Average Age
School:
43.6
District:
47.1
Source: CA Department of Education, Source: NCES 2009-2010
School Ratings and Reviews
Be The First To Review Earle E. Williams Middle School!
School Map and Similar Schools Nearby
Click to Activate Map of Nearby School Campuses
Private
Public
This School
Similar Schools Nearby
| Art Freiler School KG-8 | 1,030 Students | 1.2 miles away |  4.5 out of 5 | |
| Monte Vista Middle School 6-8 | 831 Students | 1.3 miles away | 4.5 out of 5 | |
| Gladys Poet-Christian Elementary School KG-8 | 692 Students | 1.3 miles away | Not Yet Rated | |
| North Elementary School KG-8 | 812 Students | 2.1 miles away | Not Yet Rated | |
| Banta Elementary School KG-8 | 290 Students | 4.3 miles away |  5 out of 5 | |
| Mossdale Elementary School KG-8 | 699 Students | 9.0 miles away | Not Yet Rated | - |
| Lathrop Elementary School KG-8 | 1,028 Students | 10.9 miles away | Not Yet Rated | |
| Nile Garden Elementary School KG-8 | 516 Students | 11.5 miles away | 5 out of 5 | |
| Joseph Widmer, Jr., Elementary School KG-8 | 943 Students | 11.6 miles away |  3 out of 5 | |
| Brock Elliott Elementary School KG-8 | 773 Students | 11.9 miles away | 3 out of 5 | |
Compare This School To Nearby Schools ->
School Community Forum

Join a discussion about Earle E. Williams Middle School and talk to others in the community including students, parents, teachers, and administrators.
Popular Discussion Topics
- Admissions and Registration Questions (e.g. Dress Code and Discipline Policy)
- School Calendar and Upcoming Events (e.g. Graduation)
- After School Programs, Extracurricular Activities, and Athletics (e.g. Football)
- News and Announcements (e.g. Yearbook and Class Supply List Details)
- Graduate and Alumni Events (e.g. Organizing Class Reunions)
Navigation
Can't Find What You Are Looking For?
Rankings
Nearby Cities
Sponsored Links
K-12 Articles

Preparing Your Child for the First Day of School
It seems like school was just dismissed for the summer, yet here we are facing another year of back...
It seems like school was just dismissed for the summer, yet here we are facing another year of back...

Help Your High School Student Create an Impressive Resume
Time has flown. Your teen is in high school and has demonstrated an interest in obtaining a part...
Time has flown. Your teen is in high school and has demonstrated an interest in obtaining a part...

Attend Your Teen's Holiday Parties
Christmas and New Years are coming, and with them Christmas and New Years Eve parties. At many of...
Christmas and New Years are coming, and with them Christmas and New Years Eve parties. At many of...