Monache High School

No Reviews Yet
Find Old Friends From Monache High School
Use the form below to search for alumni from Monache High School.
School Description
School Summary and Highlights
- Enrolls 1,898 high school students from grades 9-12
- Ranks 269th out of 1,197 high schools in CA.
- 2010 Overall School AYP Met Status: No
Additional Contact Information
- Mailing Address: 600 West Grand Ave., Porterville, CA 93257
School Operational Details
- Title I EligibleAll students of this school are eligible for participation in authorized programs.
School District Details
- Porterville Unified School District
- Per-Pupil Spending: $9,128
- Graduation Rate: 80.1%
- Dropout Rate: 5.6%
- Students Per Teacher: 22.6
- Enrolled Students: 13,383
Faculty Details and Student Enrollment
Students and Faculty
- Total Students Enrolled: 1,898
- Total Full Time "Equivalent" Teachers: 80.7
- Average Student-To-Teacher Ratio: 23.5
Students Gender Breakdown
- Males: 987 (52.0%)
- Females: 911 (48.0%)
Free Lunch Student Eligibility Breakdown
- Eligible for Reduced Lunch: 179 (9.4%)
- Eligible for Free Lunch: 1,221 (64.3%)
- Eligible for Either Reduced or Free Lunch: 1,400 (73.8%)
Student Enrollment Distribution by Race / Ethnicity
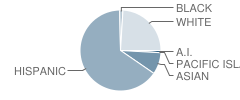
| Number | Percent | |
|---|---|---|
| American Indian | 16 | 0.8% |
| Black | 24 | 1.3% |
| Asian | 161 | 8.5% |
| Hispanic | 1,202 | 63.3% |
| White | 444 | 23.4% |
Number of Students Per Grade
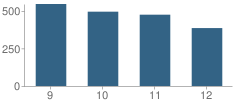
| Number | Percent | |
|---|---|---|
| 9th Grade | 545 | 28.7% |
| 10th Grade | 494 | 26.0% |
| 11th Grade | 474 | 25.0% |
| 12th Grade | 385 | 20.3% |
Graduates Information (2010)
Graduation Rate
School:
87.4%
District:
72.6%
State:
78.6%
Teacher Education Background (2009)
Percent With Ph.D.
School:
2.3%
District:
9.7%
Percent With Master's Degree
School:
15.9%
District:
25.8%
Percent With Bachelor's Degree
School:
4.5%
District:
9.7%
Teacher Credentials & Experience (2009)
Percent of Teachers With Emergency Credentials: 2.5%
Percent of Teachers With Credentials: 100.0%
Number of Certificated Staff: 88.0
Average Number of Years of Teacher Experience: 16.8
Average Age
School:
45.8
District:
45.7
Source: CA Department of Education, Source: NCES 2009-2010
School Ratings and Reviews
Be The First To Review Monache High School!
Sponsored Links
Test Scores and Performance Information
Overall School Rating
How is this determined?
The overall school rating shows that Monache High School performed on average better than many other schools across the state on CST state exams in the following subjects:
- CST Algebra I
- CST Algebra II
- CST Biology
- CST Chemistry
- CST Earth Science
- CST English-Language Arts
- CST Geometry
- CST Physics
- CST Science
- CST Summative High School Math
- CST U.S. History
- CST World History
AYP Results (2010)
Overall AYP Met: No
ELA AYP Met: No
Math AYP Met: No
Program Improvement (PI) Requirement Under NCLB (2010)
First Year PI Requirement was Implemented: 2009-2010
School's Placement Under NCLB: Year 2
ACT Exam Results (2009)
Percent of Students Taking ACT Exam: 14.3%
Average Combined Score: 19.5
Percent Scoring At or Above 21: 37.5%
SAT Exam Results (2009)
Percent of Students Taking SAT Exam: 41.2%
Average Combined Score: 1,430.7
Critical Reading Average: 468.2
Math Average: 488.5
Writing Average: 474.0
Percent Scoring At or Above 1500: 39.5%
CST - Test Proficiency by Grade and Subject
Grade 9 - % of students at or above proficiency
| School | District | State | |
|---|---|---|---|
| CST Algebra I Test | |||
| 2010 | 36.0% | 29.0% | 22.0% |
| 2009 | 31.0% | 27.0% | 21.0% |
| 2008 | 30.0% | 25.0% | 18.0% |
| CST Biology Test | |||
| 2010 | 14.0% | 18.0% | 55.0% |
| 2009 | 6.0% | 10.0% | 51.0% |
| 2008 | 9.0% | 13.0% | 52.0% |
| CST English-Language Arts Test | |||
| 2010 | 51.0% | 50.0% | 54.0% |
| 2009 | 42.0% | 42.0% | 50.0% |
| 2008 | 45.0% | 39.0% | 49.0% |
| CST Geometry Test | |||
| 2010 | 53.0% | 43.0% | 46.0% |
| 2009 | 60.0% | 53.0% | 47.0% |
| 2008 | 65.0% | 50.0% | 43.0% |
| CST Physics Test | |||
| 2010 | 34.0% | 22.0% | 40.0% |
| 2009 | 24.0% | 24.0% | 35.0% |
| 2008 | 32.0% | 32.0% | 30.0% |
Grade 10 - % of students at or above proficiency
| School | District | State | |
|---|---|---|---|
| CST Algebra I Test | |||
| 2010 | 32.0% | 20.0% | 12.0% |
| 2009 | 27.0% | 15.0% | 11.0% |
| 2008 | 15.0% | 8.0% | 9.0% |
| CST Algebra II Test | |||
| 2010 | 56.0% | 41.0% | 40.0% |
| 2009 | 69.0% | 47.0% | 37.0% |
| 2008 | 66.0% | 38.0% | 36.0% |
| CST Biology Test | |||
| 2010 | 50.0% | 42.0% | 38.0% |
| 2009 | 45.0% | 33.0% | 34.0% |
| 2008 | 55.0% | 39.0% | 35.0% |
| CST English-Language Arts Test | |||
| 2010 | 37.0% | 37.0% | 45.0% |
| 2009 | 46.0% | 36.0% | 44.0% |
| 2008 | 48.0% | 36.0% | 41.0% |
| CST Geometry Test | |||
| 2010 | 20.0% | 15.0% | 14.0% |
| 2009 | 28.0% | 16.0% | 14.0% |
| 2008 | 31.0% | 15.0% | 12.0% |
| CST Science Test | |||
| 2010 | 48.0% | 43.0% | 46.0% |
| 2009 | 50.0% | 34.0% | 44.0% |
| 2008 | 50.0% | 36.0% | 40.0% |
| CST World History Test | |||
| 2010 | 39.0% | 35.0% | 42.0% |
| 2009 | 37.0% | 29.0% | 38.0% |
| 2008 | 35.0% | 28.0% | 33.0% |
Grade 11 - % of students at or above proficiency
| School | District | State | |
|---|---|---|---|
| CST Algebra I Test | |||
| 2010 | 29.0% | 10.0% | 8.0% |
| 2009 | 27.0% | 8.0% | 8.0% |
| 2008 | 10.0% | 5.0% | 5.0% |
| CST Algebra II Test | |||
| 2010 | 42.0% | 27.0% | 14.0% |
| 2009 | 39.0% | 19.0% | 12.0% |
| 2008 | 39.0% | 18.0% | 11.0% |
| CST Chemistry Test | |||
| 2010 | 67.0% | 45.0% | 30.0% |
| 2009 | 37.0% | 24.0% | 27.0% |
| 2008 | 52.0% | 27.0% | 25.0% |
| CST Earth Science Test | |||
| 2010 | 57.0% | 38.0% | 32.0% |
| 2009 | 53.0% | 30.0% | 26.0% |
| 2008 | 55.0% | 40.0% | 28.0% |
| CST English-Language Arts Test | |||
| 2010 | 44.0% | 34.0% | 42.0% |
| 2009 | 43.0% | 31.0% | 40.0% |
| 2008 | 46.0% | 31.0% | 37.0% |
| CST Geometry Test | |||
| 2010 | 17.0% | 9.0% | 6.0% |
| 2009 | 15.0% | 9.0% | 7.0% |
| 2008 | 14.0% | 7.0% | 6.0% |
| CST Summative High School Math Test | |||
| 2010 | 77.0% | 57.0% | 50.0% |
| 2009 | 89.0% | 41.0% | 47.0% |
| 2008 | 59.0% | 43.0% | 43.0% |
| CST U.S. History Test | |||
| 2010 | 54.0% | 37.0% | 45.0% |
| 2009 | 47.0% | 34.0% | 44.0% |
| 2008 | 44.0% | 30.0% | 38.0% |
| CST World History Test | |||
| 2009 | 28.0% | 19.0% | 11.0% |
| 2008 | 38.0% | 19.0% | 9.0% |
End of Course - % of students at or above proficiency
| School | District | State | |
|---|---|---|---|
| CST Algebra I Test | |||
| 2010 | 34.0% | 28.0% | 31.0% |
| 2009 | 29.0% | 26.0% | 28.0% |
| 2008 | 23.0% | 20.0% | 25.0% |
| CST Algebra II Test | |||
| 2010 | 48.0% | 34.0% | 31.0% |
| 2009 | 52.0% | 31.0% | 28.0% |
| 2008 | 48.0% | 26.0% | 27.0% |
| CST Biology Test | |||
| 2010 | 46.0% | 37.0% | 46.0% |
| 2009 | 40.0% | 30.0% | 42.0% |
| 2008 | 48.0% | 34.0% | 42.0% |
| CST Chemistry Test | |||
| 2010 | 67.0% | 47.0% | 38.0% |
| 2009 | 36.0% | 26.0% | 36.0% |
| 2008 | 51.0% | 27.0% | 32.0% |
| CST Earth Science Test | |||
| 2010 | 57.0% | 34.0% | 33.0% |
| 2009 | 53.0% | 29.0% | 28.0% |
| 2008 | 55.0% | 36.0% | 28.0% |
| CST Geometry Test | |||
| 2010 | 26.0% | 20.0% | 27.0% |
| 2009 | 28.0% | 21.0% | 26.0% |
| 2008 | 30.0% | 17.0% | 24.0% |
| CST Physics Test | |||
| 2010 | 36.0% | 25.0% | 49.0% |
| 2009 | 24.0% | 26.0% | 46.0% |
| 2008 | 33.0% | 34.0% | 43.0% |
| CST Summative High School Math Test | |||
| 2010 | 73.0% | 60.0% | 54.0% |
| 2009 | 89.0% | 43.0% | 50.0% |
| 2008 | 58.0% | 45.0% | 47.0% |
| CST World History Test | |||
| 2010 | 39.0% | 34.0% | 41.0% |
| 2009 | 37.0% | 28.0% | 38.0% |
| 2008 | 36.0% | 27.0% | 33.0% |
Source: CA Department of Education 2009-2010
School Map and Similar Schools Nearby
Click to Activate Map of Nearby School Campuses
Private
Public
This School
Similar Schools Nearby
| Porterville High School 9-12 | 1,783 Students | 1.8 miles away | Not Yet Rated | |
| Granite Hills High School 9-12 | 1,160 Students | 3.7 miles away | ![]() 5 out of 5 | |
| Strathmore High School 9-12 | 331 Students | 4.5 miles away | Not Yet Rated | |
| Steve Garvey Junior High School 7-8 | 606 Students | 8.9 miles away | Not Yet Rated | |
| Lindsay High School 9-12 | 1,052 Students | 9.0 miles away | ![]() 4 out of 5 | |
| Exeter High School 9-12 | 1,032 Students | 15.6 miles away | ![]() 3.5 out of 5 | |
| Farmersville Junior High School 6-8 | 582 Students | 17.8 miles away | Not Yet Rated | |
| Tulare High School 9-12 | 1,880 Students | 18.3 miles away | Not Yet Rated | |
| Farmersville High School 9-12 | 678 Students | 18.3 miles away | Not Yet Rated | |
| Golden West High School 9-12 | 1,821 Students | 19.5 miles away | ![]() 4 out of 5 | |
Compare This School To Nearby Schools ->
School Community Forum

Join a discussion about Monache High School and talk to others in the community including students, parents, teachers, and administrators.
Popular Discussion Topics
- Admissions and Registration Questions (e.g. Dress Code and Discipline Policy)
- School Calendar and Upcoming Events (e.g. Graduation)
- After School Programs, Extracurricular Activities, and Athletics (e.g. Football)
- News and Announcements (e.g. Yearbook and Class Supply List Details)
- Graduate and Alumni Events (e.g. Organizing Class Reunions)
Navigation
Can't Find What You Are Looking For?
Rankings
Nearby Cities
Sponsored Links
K-12 Articles
Helping Young Children with Printing and Cursive Writing
Is your child experiencing difficulty printing or writing? Is he unable to print or write legibly,...
Transform Your Middle School Slacker into a Scholar
All children need motivation to learn. Have your child's grades decreased since he started middle...
The First Day of School
The first day of kindergarten is a rite of passage for any student. Every mother cries and...


