Cerritos High School

4 out of 5 | 4 Reviews
Find Old Friends From Cerritos High School
Use the form below to search for alumni from Cerritos High School.
School Description
School Summary and Highlights
- Enrolls 2,134 high school students from grades 9-12
- Ranks 137th out of 1,197 high schools in CA.
- 2010 Overall School AYP Met Status: Yes
Additional Contact Information
- Mailing Address: 12500 East 183rd St.., Cerritos, CA 90703
School District Details
- Abc Unified School District
- Per-Pupil Spending: $8,749
- Graduation Rate: 87.7%
- Dropout Rate: 1.9%
- Students Per Teacher: 23.1
- Enrolled Students: 20,731
Faculty Details and Student Enrollment
Students and Faculty
- Total Students Enrolled: 2,134
- Total Full Time "Equivalent" Teachers: 87.0
- Average Student-To-Teacher Ratio: 24.5
Students Gender Breakdown
- Males: 1,085 (50.8%)
- Females: 1,049 (49.2%)
Free Lunch Student Eligibility Breakdown
- Eligible for Reduced Lunch: 102 (4.8%)
- Eligible for Free Lunch: 264 (12.4%)
- Eligible for Either Reduced or Free Lunch: 366 (17.2%)
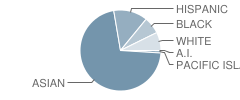
Student Enrollment Distribution by Race / Ethnicity

| Number | Percent | |
|---|---|---|
| American Indian | 6 | 0.3% |
| Black | 142 | 6.7% |
| Asian | 1,480 | 69.4% |
| Hispanic | 284 | 13.3% |
| White | 153 | 7.2% |
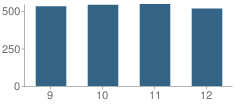
Number of Students Per Grade

| Number | Percent | |
|---|---|---|
| 9th Grade | 531 | 24.9% |
| 10th Grade | 541 | 25.4% |
| 11th Grade | 546 | 25.6% |
| 12th Grade | 516 | 24.2% |
Graduates Information (2010)
Graduation Rate
School:
95.5%
District:
89.3%
State:
78.6%
Teacher Education Background (2009)
Percent With Ph.D.
School:
2.1%
District:
6.2%
Percent With Master's Degree
School:
14.6%
District:
34.6%
Percent With Bachelor's Degree: 6.3%
Teacher Credentials & Experience (2009)
Percent of Teachers With Credentials: 100.0%
Number of Certificated Staff: 96.0
Average Number of Years of Teacher Experience: 17.0
Average Age
School:
43.6
District:
47.6
Source: CA Department of Education, Source: NCES 2009-2010
Sponsored Links
Test Scores and Performance Information
Overall School Rating
How is this determined?
The overall school rating shows that Cerritos High School performed on average better than many other schools across the state on CST state exams in the following subjects:
- CST Algebra I
- CST Algebra II
- CST Biology
- CST Chemistry
- CST English-Language Arts
- CST General Mathematics
- CST Geometry
- CST Integrated Math 1
- CST Integrated Math 2
- CST Integrated Math 3
- CST Physics
- CST Science
- CST Summative High School Math
- CST U.S. History
- CST World History
AYP Results (2010)
Overall AYP Met: Yes
ELA AYP Met: Yes
Math AYP Met: Yes
ACT Exam Results (2009)
Percent of Students Taking ACT Exam: 14.1%
Average Combined Score: 26.0
Percent Scoring At or Above 21: 91.6%
SAT Exam Results (2009)
Percent of Students Taking SAT Exam: 74.3%
Average Combined Score: 1,717.4
Critical Reading Average: 540.4
Math Average: 617.3
Writing Average: 559.8
Percent Scoring At or Above 1500: 78.9%
CST - Test Proficiency by Grade and Subject
Grade 9 - % of students at or above proficiency
| School | District | State | |
|---|---|---|---|
| CST Algebra I Test | |||
| 2010 | 20.0% | 33.0% | 22.0% |
| 2009 | 61.0% | 39.0% | 21.0% |
| 2008 | 61.0% | 35.0% | 18.0% |
| CST Algebra II Test | |||
| 2010 | 77.0% | 84.0% | 69.0% |
| 2009 | 84.0% | 85.0% | 65.0% |
| 2008 | 95.0% | 94.0% | 66.0% |
| CST Biology Test | |||
| 2010 | 66.0% | 63.0% | 55.0% |
| 2009 | 72.0% | 59.0% | 51.0% |
| 2008 | 79.0% | 67.0% | 52.0% |
| CST English-Language Arts Test | |||
| 2010 | 80.0% | 66.0% | 54.0% |
| 2009 | 79.0% | 60.0% | 50.0% |
| 2008 | 81.0% | 63.0% | 49.0% |
| CST Geometry Test | |||
| 2010 | 46.0% | 54.0% | 46.0% |
| 2009 | 70.0% | 66.0% | 47.0% |
| 2008 | 63.0% | 61.0% | 43.0% |
| CST Integrated Math 1 Test | |||
| 2010 | 17.0% | 3.0% | 28.0% |
| CST World History Test | |||
| 2010 | 89.0% | 86.0% | 45.0% |
| CST General Mathematics Test | |||
| 2009 | 35.0% | 26.0% | 17.0% |
| 2008 | 46.0% | 37.0% | 18.0% |
Grade 10 - % of students at or above proficiency
| School | District | State | |
|---|---|---|---|
| CST Algebra I Test | |||
| 2010 | 30.0% | 16.0% | 12.0% |
| 2009 | 38.0% | 26.0% | 11.0% |
| 2008 | 28.0% | 15.0% | 9.0% |
| CST Algebra II Test | |||
| 2010 | 67.0% | 70.0% | 40.0% |
| 2009 | 63.0% | 64.0% | 37.0% |
| 2008 | 64.0% | 71.0% | 36.0% |
| CST Biology Test | |||
| 2010 | 37.0% | 39.0% | 38.0% |
| 2009 | 37.0% | 36.0% | 34.0% |
| 2008 | 50.0% | 57.0% | 35.0% |
| CST Chemistry Test | |||
| 2010 | 52.0% | 58.0% | 47.0% |
| 2009 | 53.0% | 60.0% | 44.0% |
| 2008 | 45.0% | 44.0% | 41.0% |
| CST English-Language Arts Test | |||
| 2010 | 75.0% | 56.0% | 45.0% |
| 2009 | 74.0% | 57.0% | 44.0% |
| 2008 | 67.0% | 54.0% | 41.0% |
| CST Geometry Test | |||
| 2010 | 27.0% | 22.0% | 14.0% |
| 2009 | 46.0% | 25.0% | 14.0% |
| 2008 | 29.0% | 16.0% | 12.0% |
| CST Integrated Math 1 Test | |||
| 2010 | 44.0% | 16.0% | 11.0% |
| 2009 | 31.0% | 6.0% | 9.0% |
| CST Science Test | |||
| 2010 | 68.0% | 56.0% | 46.0% |
| 2009 | 73.0% | 57.0% | 44.0% |
| 2008 | 65.0% | 51.0% | 40.0% |
| CST Summative High School Math Test | |||
| 2010 | 96.0% | 94.0% | 75.0% |
| 2009 | 97.0% | 96.0% | 71.0% |
| 2008 | 82.0% | 83.0% | 68.0% |
| CST World History Test | |||
| 2010 | 65.0% | 46.0% | 42.0% |
| 2009 | 61.0% | 46.0% | 38.0% |
| 2008 | 53.0% | 42.0% | 33.0% |
Grade 11 - % of students at or above proficiency
| School | District | State | |
|---|---|---|---|
| CST Algebra II Test | |||
| 2010 | 34.0% | 34.0% | 14.0% |
| 2009 | 23.0% | 25.0% | 12.0% |
| 2008 | 31.0% | 30.0% | 11.0% |
| CST Biology Test | |||
| 2010 | 75.0% | 63.0% | 46.0% |
| 2009 | 66.0% | 43.0% | 41.0% |
| 2008 | 77.0% | 54.0% | 39.0% |
| CST Chemistry Test | |||
| 2010 | 45.0% | 41.0% | 30.0% |
| 2009 | 38.0% | 39.0% | 27.0% |
| 2008 | 57.0% | 42.0% | 25.0% |
| CST English-Language Arts Test | |||
| 2010 | 73.0% | 56.0% | 42.0% |
| 2009 | 68.0% | 51.0% | 40.0% |
| 2008 | 65.0% | 44.0% | 37.0% |
| CST Geometry Test | |||
| 2010 | 27.0% | 12.0% | 6.0% |
| 2009 | 14.0% | 10.0% | 7.0% |
| 2008 | 9.0% | 5.0% | 6.0% |
| CST Integrated Math 1 Test | |||
| 2010 | 22.0% | 11.0% | 11.0% |
| CST Integrated Math 2 Test | |||
| 2010 | 52.0% | 24.0% | 19.0% |
| 2009 | 29.0% | 12.0% | 15.0% |
| CST Physics Test | |||
| 2010 | 56.0% | 63.0% | 53.0% |
| 2009 | 41.0% | 57.0% | 50.0% |
| 2008 | 40.0% | 53.0% | 47.0% |
| CST Summative High School Math Test | |||
| 2010 | 80.0% | 78.0% | 50.0% |
| 2009 | 85.0% | 81.0% | 47.0% |
| 2008 | 71.0% | 73.0% | 43.0% |
| CST U.S. History Test | |||
| 2010 | 68.0% | 58.0% | 45.0% |
| 2009 | 71.0% | 59.0% | 44.0% |
| 2008 | 56.0% | 44.0% | 38.0% |
| CST Algebra I Test | |||
| 2008 | 3.0% | 5.0% | 5.0% |
End of Course - % of students at or above proficiency
| School | District | State | |
|---|---|---|---|
| CST Algebra I Test | |||
| 2010 | 23.0% | 46.0% | 31.0% |
| 2009 | 51.0% | 49.0% | 28.0% |
| 2008 | 42.0% | 41.0% | 25.0% |
| CST Algebra II Test | |||
| 2010 | 62.0% | 60.0% | 31.0% |
| 2009 | 55.0% | 53.0% | 28.0% |
| 2008 | 62.0% | 59.0% | 27.0% |
| CST Biology Test | |||
| 2010 | 63.0% | 56.0% | 46.0% |
| 2009 | 64.0% | 50.0% | 42.0% |
| 2008 | 74.0% | 63.0% | 42.0% |
| CST Chemistry Test | |||
| 2010 | 50.0% | 51.0% | 38.0% |
| 2009 | 48.0% | 52.0% | 36.0% |
| 2008 | 49.0% | 44.0% | 32.0% |
| CST Geometry Test | |||
| 2010 | 38.0% | 45.0% | 27.0% |
| 2009 | 53.0% | 48.0% | 26.0% |
| 2008 | 43.0% | 38.0% | 24.0% |
| CST Integrated Math 1 Test | |||
| 2010 | 28.0% | 8.0% | 13.0% |
| 2009 | 19.0% | 3.0% | 11.0% |
| CST Integrated Math 2 Test | |||
| 2010 | 49.0% | 23.0% | 27.0% |
| 2009 | 35.0% | 17.0% | 25.0% |
| CST Integrated Math 3 Test | |||
| 2010 | 69.0% | 69.0% | 37.0% |
| CST Physics Test | |||
| 2010 | 56.0% | 63.0% | 49.0% |
| 2009 | 40.0% | 57.0% | 46.0% |
| 2008 | 41.0% | 53.0% | 43.0% |
| CST Summative High School Math Test | |||
| 2010 | 84.0% | 81.0% | 54.0% |
| 2009 | 88.0% | 85.0% | 50.0% |
| 2008 | 73.0% | 75.0% | 47.0% |
| CST World History Test | |||
| 2010 | 69.0% | 53.0% | 41.0% |
| 2009 | 59.0% | 52.0% | 38.0% |
| 2008 | 51.0% | 46.0% | 33.0% |
| CST General Mathematics Test | |||
| 2009 | 35.0% | 27.0% | 26.0% |
| 2008 | 46.0% | 32.0% | 27.0% |
Source: CA Department of Education 2009-2010
School Map and Similar Schools Nearby
Click to Activate Map of Nearby School Campuses
Private
Public
This School
Similar Schools Nearby
| Gretchen Whitney High School 7-12 | 1,022 Students | 1.1 miles away | ![]() 5 out of 5 | |
| Artesia High School 9-12 | 1,688 Students | 1.5 miles away | ![]() 5 out of 5 | |
| Richard Gahr High School 9-12 | 2,058 Students | 1.9 miles away | ![]() 5 out of 5 | |
| John F. Kennedy High School 9-12 | 2,401 Students | 2.2 miles away | Not Yet Rated | |
| Walker Junior High School 7-8 | 1,199 Students | 2.2 miles away | Not Yet Rated | |
| Mayfair High School 7-12 | 3,579 Students | 2.8 miles away | Not Yet Rated | |
| Lexington Junior High School 7-8 | 1,215 Students | 2.9 miles away | ![]() 5 out of 5 | |
| John H. Glenn High School 9-12 | 1,871 Students | 3.0 miles away | Not Yet Rated | |
| Buena Park Junior High School 7-8 | 1,150 Students | 3.1 miles away | ![]() 5 out of 5 | |
| Norwalk High School 9-12 | 2,321 Students | 3.2 miles away | ![]() 3 out of 5 | |
Compare This School To Nearby Schools ->
School Community Forum

Join a discussion about Cerritos High School and talk to others in the community including students, parents, teachers, and administrators.
Popular Discussion Topics
- Admissions and Registration Questions (e.g. Dress Code and Discipline Policy)
- School Calendar and Upcoming Events (e.g. Graduation)
- After School Programs, Extracurricular Activities, and Athletics (e.g. Football)
- News and Announcements (e.g. Yearbook and Class Supply List Details)
- Graduate and Alumni Events (e.g. Organizing Class Reunions)
Navigation
Can't Find What You Are Looking For?
Rankings
Nearby Cities
Sponsored Links
K-12 Articles
Who is Safe?
Between September 26 and October 2, 2006, there were three deadly school shootings and...
Helping Your Learning Disabled Child
Thousands of children in America struggle to learn on a daily basis. Many of them have invisible...
Teaching Children a Love of History
Parents and grandparents are responsible for teaching children a love of history. To begin, relate...


(5 / 5)
(2 / 5)
(3 / 5) 
