Frank Paul Elementary School
Rating
Not Available
Not Available

5 out of 5 | 1 Review
Find Old Friends From Frank Paul Elementary School
Use the form below to search for alumni from Frank Paul Elementary School.
School Description
School Summary and Highlights
- Enrolls 743 elementary school students from grades KG-6
- Ranks 5057th out of 5,423 elementary schools in CA.
- 2010 Overall School AYP Met Status: No
Additional Contact Information
- Mailing Address: 1300 Rider Ave., Salinas, CA 93905
School Operational Details
- Title I EligibleAll students of this school are eligible for participation in authorized programs.
School District Details
- Alisal Union Elementary School District
- Per-Pupil Spending: $9,452
- Students Per Teacher: 26.3
- Enrolled Students: 7,862
Faculty Details and Student Enrollment
Students and Faculty
- Total Students Enrolled: 743
- Total Full Time "Equivalent" Teachers: 29.0
- Average Student-To-Teacher Ratio: 25.6
Students Gender Breakdown
- Males: 379 (51.0%)
- Females: 364 (49.0%)
Free Lunch Student Eligibility Breakdown
- Eligible for Reduced Lunch: 36 (4.8%)
- Eligible for Free Lunch: 665 (89.5%)
- Eligible for Either Reduced or Free Lunch: 701 (94.3%)
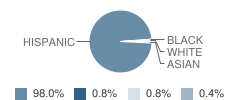
Student Enrollment Distribution by Race / Ethnicity
| Number | Percent | |
|---|---|---|
| American Indian | - | - |
| Black | 3 | 0.4% |
| Asian | 6 | 0.8% |
| Hispanic | 727 | 97.8% |
| White | 6 | 0.8% |
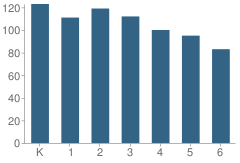
Number of Students Per Grade
| Number | Percent | |
|---|---|---|
| Kindergarten | 123 | 16.6% |
| 1st Grade | 111 | 14.9% |
| 2nd Grade | 119 | 16.0% |
| 3rd Grade | 112 | 15.1% |
| 4th Grade | 100 | 13.5% |
| 5th Grade | 95 | 12.8% |
| 6th Grade | 83 | 11.2% |
Teacher Education Background (2009)
Percent With Bachelor's Degree
School:
5.9%
District:
14.3%
Teacher Credentials & Experience (2009)
Percent of Teachers With Credentials: 100.0%
Number of Certificated Staff: 34.0
Average Number of Years of Teacher Experience: 9.6
Average Age
School:
41.9
District:
50.6
Source: CA Department of Education, Source: NCES 2009-2010
School Ratings and Reviews
Overall Rating: 5

5 out of 5 | 1 Review
The Overall Rating is the school's average rating from parents, students, school faculty and staff. The highest rating is five apples and the lowest is one apple.
Share Your Review About This School
1 review for Frank Paul Elementary School
- Reviewed by Former Student on February 09, 2009
- Rating:
 (5 / 5) Flag as inappropriate
School Map and Similar Schools Nearby
Click to Activate Map of Nearby School Campuses
Private
Public
This School
Similar Schools Nearby
| Virginia Rocca Barton Elementary School KG-6 | 567 Students | 0.3 miles away | Not Yet Rated | |
| Cesar E. Chavez Elementary School KG-6 | 790 Students | 0.6 miles away | Not Yet Rated | |
| Dr. Martin Luther King, Jr. Elementary School 4-6 | 514 Students | 0.7 miles away | Not Yet Rated | |
| Jesse G. Sanchez Elementary School KG-3 | 675 Students | 0.7 miles away |  5 out of 5 | |
| Alisal Community School KG-6 | 660 Students | 0.8 miles away | Not Yet Rated | |
| Creekside Elementary School KG-6 | 658 Students | 0.9 miles away | Not Yet Rated | |
| Oscar F. Loya Elementary School KG-6 | 814 Students | 1.0 miles away | 5 out of 5 | |
| John E. Steinbeck Elementary School KG-6 | 604 Students | 1.1 miles away | Not Yet Rated | |
| Fremont Elementary School KG-6 | 793 Students | 1.2 miles away | Not Yet Rated | |
| Loma Vista Elementary School KG-6 | 613 Students | 1.3 miles away | 5 out of 5 | |
Compare This School To Nearby Schools ->
School Community Forum

Join a discussion about Frank Paul Elementary School and talk to others in the community including students, parents, teachers, and administrators.
Popular Discussion Topics
- Admissions and Registration Questions (e.g. Dress Code and Discipline Policy)
- School Calendar and Upcoming Events (e.g. Graduation)
- After School Programs, Extracurricular Activities, and Athletics (e.g. Football)
- News and Announcements (e.g. Yearbook and Class Supply List Details)
- Graduate and Alumni Events (e.g. Organizing Class Reunions)
Navigation
Can't Find What You Are Looking For?
Rankings
Nearby Cities
Sponsored Links
K-12 Articles

Teach Your Child to Write Well
When American children head off to junior kindergarten, they must be ready to learn. It is your...
When American children head off to junior kindergarten, they must be ready to learn. It is your...

What to Do when Your Child Hates School
All kids grumble about going to school at one time or another. This is perfectly normal, but what...
All kids grumble about going to school at one time or another. This is perfectly normal, but what...

National Memories
Few events are seared into our memory, and bring the country together-not as Democrat and...
Few events are seared into our memory, and bring the country together-not as Democrat and...