Alpaugh Junior-High School
Rating
Not Available
Not Available

No Reviews Yet
Find Old Friends From Alpaugh Junior-High School
Use the form below to search for alumni from Alpaugh Junior-High School.
School Description
School Summary and Highlights
- Enrolls 134 middle and high school students from grades 7-12
- Ranks 928th out of 1,197 high schools in CA.
- 2010 Overall School AYP Met Status: Yes
Additional Contact Information
- Mailing Address: PO Box 9, Alpaugh, CA 93201
School Operational Details
- Title I Eligible
School District Details
- Alpaugh Unified School District
- Per-Pupil Spending: $9,714
- Graduation Rate: 56.5%
- Dropout Rate: 7.0%
- Students Per Teacher: 20.1
- Enrolled Students: 474
Faculty Details and Student Enrollment
Students and Faculty
- Total Students Enrolled: 134
- Total Full Time "Equivalent" Teachers: 11.0
- Average Student-To-Teacher Ratio: 12.2
Students Gender Breakdown
- Males: 72 (53.7%)
- Females: 62 (46.3%)
Free Lunch Student Eligibility Breakdown
- Eligible for Reduced Lunch: - (-)
- Eligible for Free Lunch: 131 (97.8%)
- Eligible for Either Reduced or Free Lunch: 131 (97.8%)
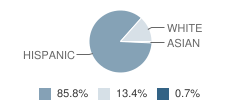
Student Enrollment Distribution by Race / Ethnicity
| Number | Percent | |
|---|---|---|
| American Indian | - | - |
| Black | - | - |
| Asian | 1 | 0.7% |
| Hispanic | 115 | 85.8% |
| White | 18 | 13.4% |
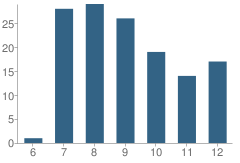
Number of Students Per Grade
| Number | Percent | |
|---|---|---|
| 6th Grade | 1 | 0.7% |
| 7th Grade | 28 | 20.9% |
| 8th Grade | 29 | 21.6% |
| 9th Grade | 26 | 19.4% |
| 10th Grade | 19 | 14.2% |
| 11th Grade | 14 | 10.4% |
| 12th Grade | 17 | 12.7% |
Teacher Education Background (2009)
Percent With Master's Degree: 15.4%
Percent With Bachelor's Degree: 69.2%
Teacher Credentials & Experience (2009)
Percent of Teachers With Emergency Credentials: 7.7%
Percent of Teachers With Credentials: 84.6%
Number of Certificated Staff: 13.0
Average Number of Years of Teacher Experience: 8.3
Average Age
School:
40.1
District:
53.5
Source: CA Department of Education, Source: NCES 2009-2010
School Ratings and Reviews
Be The First To Review Alpaugh Junior-High School!
School Map and Similar Schools Nearby
Click to Activate Map of Nearby School Campuses
Private
Public
This School
Similar Schools Nearby
| Robert F. Kennedy High School 9-12 | 844 Students | 14.4 miles away | Not Yet Rated | - |
| Corcoran High School 9-12 | 924 Students | 15.4 miles away | Not Yet Rated | |
| Delano High School 9-12 | 1,869 Students | 15.7 miles away |  4 out of 5 | |
| Cesar E. Chavez High School 9-12 | 1,548 Students | 16.8 miles away | Not Yet Rated | |
| Mcfarland High School 9-12 | 880 Students | 20.7 miles away | Not Yet Rated | |
| Mission Oak High School 9-12 | 1,018 Students | 21.4 miles away | Not Yet Rated | - |
| Wasco High School 9-12 | 1,659 Students | 21.6 miles away |  1 out of 5 | |
| Tulare High School 9-12 | 1,880 Students | 23.7 miles away | Not Yet Rated | |
| Tulare Western High School 9-12 | 1,919 Students | 23.9 miles away | Not Yet Rated | |
| Monache High School 9-12 | 1,898 Students | 27.8 miles away | Not Yet Rated | |
Compare This School To Nearby Schools ->
School Community Forum

Join a discussion about Alpaugh Junior-High School and talk to others in the community including students, parents, teachers, and administrators.
Popular Discussion Topics
- Admissions and Registration Questions (e.g. Dress Code and Discipline Policy)
- School Calendar and Upcoming Events (e.g. Graduation)
- After School Programs, Extracurricular Activities, and Athletics (e.g. Football)
- News and Announcements (e.g. Yearbook and Class Supply List Details)
- Graduate and Alumni Events (e.g. Organizing Class Reunions)
Navigation
Can't Find What You Are Looking For?
Rankings
Nearby Cities
Sponsored Links
K-12 Articles

Tips for Easing Your Child's Back to School Stress
Do you remember the roller coaster of emotions that you experienced as a child when the day for...
Do you remember the roller coaster of emotions that you experienced as a child when the day for...

Attend Your Teen's Holiday Parties
Christmas and New Years are coming, and with them Christmas and New Years Eve parties. At many of...
Christmas and New Years are coming, and with them Christmas and New Years Eve parties. At many of...

Teaching Kids to Deal with Peer Pressure
Parents usually become very concerned when they hear the term "peer pressure." However, peer...
Parents usually become very concerned when they hear the term "peer pressure." However, peer...