Joseph George Middle School
Rating
Not Available
Not Available

3 out of 5 | 1 Review
Find Old Friends From Joseph George Middle School
Use the form below to search for alumni from Joseph George Middle School.
School Description
School Summary and Highlights
- Enrolls 560 middle school students from grades 6-8
- Ranks 1698th out of 2,050 middle schools in CA.
- 2010 Overall School AYP Met Status: No
Additional Contact Information
- Mailing Address: 277 Mahoney Dr., San Jose, CA 95127
School District Details
- Alum Rock Union Elementary School District
- Per-Pupil Spending: $9,664
- Students Per Teacher: 20.2
- Enrolled Students: 13,368
Faculty Details and Student Enrollment
Students and Faculty
- Total Students Enrolled: 560
- Total Full Time "Equivalent" Teachers: 30.0
- Average Student-To-Teacher Ratio: 18.7
Students Gender Breakdown
- Males: 297 (53.0%)
- Females: 263 (47.0%)
Free Lunch Student Eligibility Breakdown
- Eligible for Reduced Lunch: 69 (12.3%)
- Eligible for Free Lunch: 383 (68.4%)
- Eligible for Either Reduced or Free Lunch: 452 (80.7%)
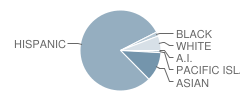
Student Enrollment Distribution by Race / Ethnicity
| Number | Percent | |
|---|---|---|
| American Indian | 2 | 0.4% |
| Black | 10 | 1.8% |
| Asian | 66 | 11.8% |
| Hispanic | 445 | 79.5% |
| White | 33 | 5.9% |
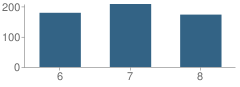
Number of Students Per Grade
| Number | Percent | |
|---|---|---|
| 6th Grade | 179 | 32.0% |
| 7th Grade | 208 | 37.1% |
| 8th Grade | 173 | 30.9% |
Teacher Education Background (2009)
Percent With Master's Degree
School:
14.3%
District:
24.6%
Percent With Bachelor's Degree
School:
51.4%
District:
37.7%
Teacher Credentials & Experience (2009)
Percent of Teachers With Emergency Credentials: 3.1%
Percent of Teachers With Credentials: 71.9%
Number of Certificated Staff: 35.0
Average Number of Years of Teacher Experience: 7.5
Average Age
School:
37.8
District:
48.7
Source: CA Department of Education, Source: NCES 2009-2010
School Ratings and Reviews
Overall Rating: 3

3 out of 5 | 1 Review
The Overall Rating is the school's average rating from parents, students, school faculty and staff. The highest rating is five apples and the lowest is one apple.
Share Your Review About This School
1 review for Joseph George Middle School
- Reviewed by Parent/Guardian on July 14, 2009
- Rating:
 (3 / 5) Flag as inappropriate
 - its okay not great my childs school ayp was 800
School Map and Similar Schools Nearby
Click to Activate Map of Nearby School Campuses
Private
Public
This School
Similar Schools Nearby
| Pala Middle School 6-8 | 400 Students | 1.0 miles away | Not Yet Rated | |
| Thomas P. Ryan Elementary School KG-6 | 494 Students | 1.6 miles away | Not Yet Rated | |
| Sheppard School 6-8 | 558 Students | 1.6 miles away | Not Yet Rated | |
| August Boeger Junior High School 6-8 | 907 Students | 1.8 miles away | Not Yet Rated | |
| Piedmont Middle School 6-8 | 998 Students | 2.1 miles away |  5 out of 5 | |
| Ocala Middle School 6-8 | 584 Students | 2.2 miles away |  4 out of 5 | |
| Lee Mathson Middle School 6-8 | 595 Students | 2.2 miles away | 5 out of 5 | |
| Clyde L. Fischer Middle School 6-8 | 626 Students | 2.5 miles away | 5 out of 5 | |
| Cedar Grove Elementary School KG-6 | 783 Students | 3.0 miles away | Not Yet Rated | |
| Katherine R. Smith Elementary School KG-6 | 688 Students | 3.1 miles away |  3 out of 5 | |
Compare This School To Nearby Schools ->
School Community Forum

Join a discussion about Joseph George Middle School and talk to others in the community including students, parents, teachers, and administrators.
Popular Discussion Topics
- Admissions and Registration Questions (e.g. Dress Code and Discipline Policy)
- School Calendar and Upcoming Events (e.g. Graduation)
- After School Programs, Extracurricular Activities, and Athletics (e.g. Football)
- News and Announcements (e.g. Yearbook and Class Supply List Details)
- Graduate and Alumni Events (e.g. Organizing Class Reunions)
Navigation
Can't Find What You Are Looking For?
Rankings
Sponsored Links
K-12 Articles

Teaching Your Child Study Skills
Many children who have the capability to get good grades experience frustration because of low...
Many children who have the capability to get good grades experience frustration because of low...

Making Sense of No Child Left Behind
The No Child Left Behind Act of 2001 has met with mixed results and mixed feelings. Some think it...
The No Child Left Behind Act of 2001 has met with mixed results and mixed feelings. Some think it...

When Bad Report Cards Happen to Good Kids
It's mid-term season once again, and semester (or quarter or trimester) grades will be coming out...
It's mid-term season once again, and semester (or quarter or trimester) grades will be coming out...