Desert Sands Charter School
Rating
Not Available
Not Available

5 out of 5 | 1 Review
Find Old Friends From Desert Sands Charter School
Use the form below to search for alumni from Desert Sands Charter School.
School Description
School Summary and Highlights
- Enrolls 1,867 high school students from grades 9-12
- Ranks 1162nd out of 1,197 high schools in CA.
- 2010 Overall School AYP Met Status: No
Additional Contact Information
- Mailing Address: 42455 10th St., West, Ste. 105, Lancaster, CA 93534
School Operational Details
- Charter School
School District Details
- Antelope Valley Union High School District
- Per-Pupil Spending: $8,017
- Graduation Rate: 87.0%
- Dropout Rate: 6.5%
- Students Per Teacher: 23.6
- Enrolled Students: 26,211
Faculty Details and Student Enrollment
Students and Faculty
- Total Students Enrolled: 1,867
- Total Full Time "Equivalent" Teachers: 58.7
- Average Student-To-Teacher Ratio: 31.8
Students Gender Breakdown
- Males: 877 (47.0%)
- Females: 990 (53.0%)
Free Lunch Student Eligibility Breakdown
- Eligible for Reduced Lunch: 280 (15.0%)
- Eligible for Free Lunch: 835 (44.7%)
- Eligible for Either Reduced or Free Lunch: 1,115 (59.7%)
Student Enrollment Distribution by Race / Ethnicity
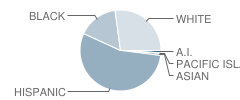
| Number | Percent | |
|---|---|---|
| American Indian | 19 | 1.0% |
| Black | 298 | 16.0% |
| Asian | 17 | 0.9% |
| Hispanic | 1,014 | 54.3% |
| White | 503 | 26.9% |
Number of Students Per Grade
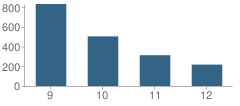
| Number | Percent | |
|---|---|---|
| 9th Grade | 831 | 44.5% |
| 10th Grade | 503 | 26.9% |
| 11th Grade | 312 | 16.7% |
| 12th Grade | 217 | 11.6% |
| Ungraded | 4 | 0.2% |
Graduates Information (2010)
Graduation Rate
School:
43.7%
District:
80.2%
State:
78.6%
Teacher Education Background (2009)
Percent With Ph.D.
School:
5.9%
District:
9.8%
Percent With Master's Degree
School:
13.2%
District:
47.1%
Percent With Bachelor's Degree
School:
8.8%
District:
11.8%
Teacher Credentials & Experience (2009)
Percent of Teachers With Credentials: 94.0%
Number of Certificated Staff: 68.0
Average Number of Years of Teacher Experience: 10.4
Average Age
School:
43.5
District:
45.9
Source: CA Department of Education, Source: NCES 2009-2010
School Ratings and Reviews
Overall Rating: 5

5 out of 5 | 1 Review
The Overall Rating is the school's average rating from parents, students, school faculty and staff. The highest rating is five apples and the lowest is one apple.
Share Your Review About This School
1 review for Desert Sands Charter School
- Reviewed by Parent/Guardian on September 18, 2008
- Rating:
 (5 / 5) Flag as inappropriate
 - Best of the best!!!
School Map and Similar Schools Nearby
Click to Activate Map of Nearby School Campuses
Private
Public
This School
Similar Schools Nearby
| Los Angeles County Online High School 9-12 | 630 Students | 8.8 miles away | Not Yet Rated | - |
Compare This School To Nearby Schools ->
School Community Forum

Join a discussion about Desert Sands Charter School and talk to others in the community including students, parents, teachers, and administrators.
Popular Discussion Topics
- Admissions and Registration Questions (e.g. Dress Code and Discipline Policy)
- School Calendar and Upcoming Events (e.g. Graduation)
- After School Programs, Extracurricular Activities, and Athletics (e.g. Football)
- News and Announcements (e.g. Yearbook and Class Supply List Details)
- Graduate and Alumni Events (e.g. Organizing Class Reunions)
Navigation
Can't Find What You Are Looking For?
Rankings
Nearby Cities
Sponsored Links
K-12 Articles

Teacher Tenure: A Double-Edged Sword
Teacher Tenure (the policy making it almost impossible to fire teachers) has noble roots. It was...
Teacher Tenure (the policy making it almost impossible to fire teachers) has noble roots. It was...

Halloween Safety Tips
Ghosts and witches sit beside mistletoe and tinsel on store shelves. Orange and black deck the...
Ghosts and witches sit beside mistletoe and tinsel on store shelves. Orange and black deck the...

Teaching Your Child Study Skills
Many children who have the capability to get good grades experience frustration because of low...
Many children who have the capability to get good grades experience frustration because of low...