Liverpool Elementary School
Rating
Not Available
Not Available

No Reviews Yet
Find Old Friends From Liverpool Elementary School
Use the form below to search for alumni from Liverpool Elementary School.
School Description
School Summary and Highlights
- Enrolls 342 preschool and elementary school students from grades PK-6
- Ranks 1528th out of 2,535 elementary schools in NY.
Additional Contact Information
- Principal or Admin: William Mugridge
School Operational Details
- Title I Eligible
School District Details
- Liverpool Central School District
- Per-Pupil Spending: $15,782
- Graduation Rate: 85.8%
- Dropout Rate: 2.5%
- Students Per Teacher: 13.8
- Enrolled Students: 7,669
Faculty Details and Student Enrollment
Students and Faculty
- Total Students Enrolled: 342
- Total Full Time "Equivalent" Teachers: 26.0
- Average Student-To-Teacher Ratio: 13.2
Students Gender Breakdown
- Males: 160 (46.8%)
- Females: 182 (53.2%)
Free Lunch Student Eligibility Breakdown
- Eligible for Reduced Lunch: 33 (9.6%)
- Eligible for Free Lunch: 90 (26.3%)
- Eligible for Either Reduced or Free Lunch: 123 (36.0%)
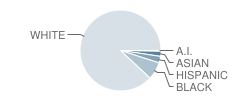
Student Enrollment Distribution by Race / Ethnicity
| Number | Percent | |
|---|---|---|
| American Indian | 1 | 0.3% |
| Black | 24 | 7.0% |
| Asian | 7 | 2.0% |
| Hispanic | 9 | 2.6% |
| White | 301 | 88.0% |
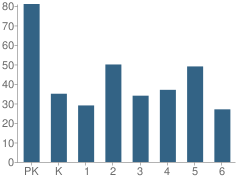
Number of Students Per Grade
| Number | Percent | |
|---|---|---|
| Pre-Kindergarten | 81 | 23.7% |
| Kindergarten | 35 | 10.2% |
| 1st Grade | 29 | 8.5% |
| 2nd Grade | 50 | 14.6% |
| 3rd Grade | 34 | 9.9% |
| 4th Grade | 37 | 10.8% |
| 5th Grade | 49 | 14.3% |
| 6th Grade | 27 | 7.9% |
Public Assistance (2010)
Estimated Percent of Students From Households That Receive Public Assistance: 41-50%
Attendance & Suspensions (2009)
Attendance Rate
School:
95.0%
District:
95.0%
State:
93.0%
Percent of Students Suspended
School:
1.0%
District:
5.0%
State:
5.0%
Teacher Experience & Educational Background (2010)
Percent of Teachers with Less Than 3 Years of Experience
School:
7.0%
District:
6.0%
Percent of Teachers with Master's or Ph.D.
School:
33.0%
District:
25.0%
Teacher Turnover Rates (2010)
Turnover Rate For All Teachers
School:
14.0%
District:
12.0%
Turnover Rate For Teachers with Less Than 5 Years of Experience
School:
33.0%
District:
24.0%
Source: NY Department of Education, Source: NCES 2009-2010
School Ratings and Reviews
Be The First To Review Liverpool Elementary School!
School Map and Similar Schools Nearby
Click to Activate Map of Nearby School Campuses
Private
Public
This School
Similar Schools Nearby
| Long Branch Elementary School KG-6 | 423 Students | 1.4 miles away | Not Yet Rated | |
| Elmcrest Elementary School KG-6 | 426 Students | 1.8 miles away | Not Yet Rated | |
| Solvay Middle School 4-8 | 541 Students | 1.9 miles away | Not Yet Rated | |
| Chestnut Hill Elementary School PK-6 | 427 Students | 2.2 miles away | Not Yet Rated | |
| Donlin Drive Elementary School KG-6 | 382 Students | 2.3 miles away | Not Yet Rated | |
| Wetzel Road Elementary School KG-6 | 359 Students | 2.8 miles away | Not Yet Rated | |
| Nate Perry Elementary School KG-6 | 439 Students | 3.0 miles away | Not Yet Rated | |
| Morgan Road Elementary School KG-6 | 444 Students | 3.5 miles away | Not Yet Rated | |
| Allen Road Elementary School KG-4 | 441 Students | 3.6 miles away | Not Yet Rated | |
| Solvay Elementary School KG-3 | 400 Students | 3.6 miles away |  1 out of 5 | |
Compare This School To Nearby Schools ->
School Community Forum

Join a discussion about Liverpool Elementary School and talk to others in the community including students, parents, teachers, and administrators.
Popular Discussion Topics
- Admissions and Registration Questions (e.g. Dress Code and Discipline Policy)
- School Calendar and Upcoming Events (e.g. Graduation)
- After School Programs, Extracurricular Activities, and Athletics (e.g. Football)
- News and Announcements (e.g. Yearbook and Class Supply List Details)
- Graduate and Alumni Events (e.g. Organizing Class Reunions)
Navigation
Can't Find What You Are Looking For?
Rankings
Nearby Cities
Sponsored Links
K-12 Articles

Where in the World is Carmen Sandiego?
One of the sensations on YouTube highlights the state of our education system. The spot was...
One of the sensations on YouTube highlights the state of our education system. The spot was...

Helping Your Child Leave the Nest
It's all come down to this: Eighteen years of good times and bad, and now your baby bird is ready...
It's all come down to this: Eighteen years of good times and bad, and now your baby bird is ready...

Break the Cycle: Teen Dating Violence and Prevention Week
February 5 through 9 was "National Teen Dating Violence Awareness and Prevention Week"....
February 5 through 9 was "National Teen Dating Violence Awareness and Prevention Week"....