Emerson Middle School
Rating
Not Available
Not Available

4 out of 5 | 2 Reviews
Find Old Friends From Emerson Middle School
Use the form below to search for alumni from Emerson Middle School.
School Description
School Summary and Highlights
- Enrolls 837 middle school students from grades 6-8
- Ranks 1960th out of 2,050 middle schools in CA.
- 2010 Overall School AYP Met Status: No
Additional Contact Information
- Mailing Address: 801 Fourth St., Bakersfield, CA 93304
School Operational Details
- Title I EligibleAll students of this school are eligible for participation in authorized programs.
School District Details
- Bakersfield City School District
- Per-Pupil Spending: $9,705
- Students Per Teacher: 20.0
- Enrolled Students: 27,267
Faculty Details and Student Enrollment
Students and Faculty
- Total Students Enrolled: 837
- Total Full Time "Equivalent" Teachers: 33.0
- Average Student-To-Teacher Ratio: 25.4
Students Gender Breakdown
- Males: 440 (52.6%)
- Females: 397 (47.4%)
Free Lunch Student Eligibility Breakdown
- Eligible for Reduced Lunch: 34 (4.1%)
- Eligible for Free Lunch: 753 (90.0%)
- Eligible for Either Reduced or Free Lunch: 787 (94.0%)
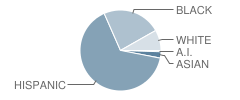
Student Enrollment Distribution by Race / Ethnicity
| Number | Percent | |
|---|---|---|
| American Indian | 4 | 0.5% |
| Black | 193 | 23.1% |
| Asian | 21 | 2.5% |
| Hispanic | 540 | 64.5% |
| White | 68 | 8.1% |
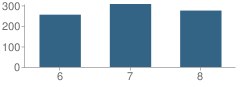
Number of Students Per Grade
| Number | Percent | |
|---|---|---|
| 6th Grade | 255 | 30.5% |
| 7th Grade | 307 | 36.7% |
| 8th Grade | 275 | 32.9% |
Teacher Education Background (2009)
Percent With Bachelor's Degree
School:
5.7%
District:
10.6%
Teacher Credentials & Experience (2009)
Percent of Teachers With Emergency Credentials: 12.9%
Percent of Teachers With Credentials: 93.5%
Number of Certificated Staff: 35.0
Average Number of Years of Teacher Experience: 8.4
Average Age
School:
38.0
District:
45.7
Source: CA Department of Education, Source: NCES 2009-2010
School Ratings and Reviews
Overall Rating: 4

4 out of 5 | 2 Reviews
The Overall Rating is the school's average rating from parents, students, school faculty and staff. The highest rating is five apples and the lowest is one apple.
Share Your Review About This School
2 reviews for Emerson Middle School
- Reviewed by Parent or Guardian on March 24, 2011
- Rating:
 (3 / 5) Flag as inappropriate
 - My name is Natasha N.Aaron-Jackson, and I am the parent of three girls ages 11,9,and 14 years-old. My oldest started attending Emerson from August 2008-current year. Over the few years that my daughter has been attending Emerson Middle school I have noticed that the C.S.T State Scores have not been that high and varies between grades 6-8th. As a parent, these test scores worries me and therefore, encourages people such as, I to strongly volunteer to all students within Emerson Middle School some extra academic help(tutoring), so many students can better themselves on the C.S.T. exam given each year. Along with offering better academic strategies to studying,so this could help them in their current and future educational goals(high school & College goals).Emerson Middle School may be known for their negative disciplinary problems, but with a little academic support from parents like me, Emerson Middle School could rise above all this negativity.
Sincerely,
Natasha N.Aaron-Jackson
(Parent of 8th grader)
- Reviewed by Parent/Guardian on August 25, 2009
- Rating:
 (5 / 5) Flag as inappropriate
 - Don't like Emerson, and it's in one of the worst areas in Bakersfield. Over my dead body will my grandkids go there.
School Map and Similar Schools Nearby
Click to Activate Map of Nearby School Campuses
Private
Public
This School
Similar Schools Nearby
| Fremont Elementary School KG-6 | 888 Students | 0.7 miles away | Not Yet Rated | |
| Sequoia Middle School 6-8 | 887 Students | 1.0 miles away | Not Yet Rated | |
| Downtown Elementary School KG-8 | 311 Students | 1.2 miles away | Not Yet Rated | |
| Bessie E. Owens Intermediate School 4-6 | 487 Students | 1.2 miles away | Not Yet Rated | |
| Franklin Elementary School KG-6 | 456 Students | 1.4 miles away |  4 out of 5 | |
| Longfellow Elementary School KG-6 | 698 Students | 2.0 miles away | Not Yet Rated | |
| Mt. Vernon Elementary School KG-6 | 808 Students | 2.3 miles away |  3 out of 5 | |
| Curran Middle School 6-8 | 812 Students | 2.3 miles away | Not Yet Rated | |
| Amy B. Seibert Elementary School KG-6 | 705 Students | 2.6 miles away | Not Yet Rated | |
| Wayne Van Horn Elementary School KG-6 | 660 Students | 3.0 miles away |  2.5 out of 5 | |
Compare This School To Nearby Schools ->
School Community Forum

Join a discussion about Emerson Middle School and talk to others in the community including students, parents, teachers, and administrators.
Popular Discussion Topics
- Admissions and Registration Questions (e.g. Dress Code and Discipline Policy)
- School Calendar and Upcoming Events (e.g. Graduation)
- After School Programs, Extracurricular Activities, and Athletics (e.g. Football)
- News and Announcements (e.g. Yearbook and Class Supply List Details)
- Graduate and Alumni Events (e.g. Organizing Class Reunions)
Navigation
Can't Find What You Are Looking For?
Rankings
Nearby Cities
Sponsored Links
K-12 Articles

Teachers Packing Heat
After the recent school shootings (and thwarted school shootings) in the past month-just as after...
After the recent school shootings (and thwarted school shootings) in the past month-just as after...

Help Your Child Achieve Success in Middle School
Middle school is for children between the ages of 10 and 14 years. At this time children begin to...
Middle school is for children between the ages of 10 and 14 years. At this time children begin to...

Imho
I was watching Headline News's news ticker when I read something that made me LOL. The ticker said...
I was watching Headline News's news ticker when I read something that made me LOL. The ticker said...