Banning High School

No Reviews Yet
Find Old Friends From Banning High School
Use the form below to search for alumni from Banning High School.
School Description
School Summary and Highlights
- Enrolls 1,170 high school students from grades 9-12
- Ranks 1092nd out of 1,197 high schools in CA.
- 2010 Overall School AYP Met Status: No
School District Details
- Banning Unified School District
- Per-Pupil Spending: $9,083
- Graduation Rate: 67.9%
- Dropout Rate: 3.0%
- Students Per Teacher: 19.7
- Enrolled Students: 4,693
Faculty Details and Student Enrollment
Students and Faculty
- Total Students Enrolled: 1,170
- Total Full Time "Equivalent" Teachers: 53.0
- Average Student-To-Teacher Ratio: 22.1
Students Gender Breakdown
- Males: 594 (50.8%)
- Females: 576 (49.2%)
Free Lunch Student Eligibility Breakdown
- Eligible for Reduced Lunch: 207 (17.7%)
- Eligible for Free Lunch: 754 (64.4%)
- Eligible for Either Reduced or Free Lunch: 961 (82.1%)
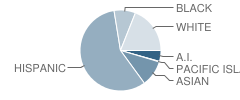
Student Enrollment Distribution by Race / Ethnicity

| Number | Percent | |
|---|---|---|
| American Indian | 51 | 4.4% |
| Black | 99 | 8.5% |
| Asian | 120 | 10.3% |
| Hispanic | 658 | 56.2% |
| White | 218 | 18.6% |
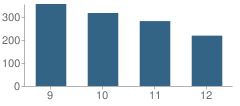
Number of Students Per Grade

| Number | Percent | |
|---|---|---|
| 9th Grade | 355 | 30.3% |
| 10th Grade | 316 | 27.0% |
| 11th Grade | 281 | 24.0% |
| 12th Grade | 218 | 18.6% |
Graduates Information (2010)
Graduation Rate
School:
78.8%
District:
75.7%
State:
78.6%
Teacher Education Background (2009)
Percent With Ph.D.
School:
4.6%
District:
17.4%
Percent With Master's Degree
School:
55.4%
District:
65.2%
Percent With Bachelor's Degree: 6.2%
Teacher Credentials & Experience (2009)
Percent of Teachers With Credentials: 100.0%
Number of Certificated Staff: 65.0
Average Number of Years of Teacher Experience: 13.3
Average Age
School:
43.6
District:
46.4
Source: CA Department of Education, Source: NCES 2009-2010
School Ratings and Reviews
Be The First To Review Banning High School!
Sponsored Links
Test Scores and Performance Information
Overall School Rating
How is this determined?
The overall school rating shows that Banning High School performed on average worse than many other schools across the state on CST state exams in the following subjects:
- CST Algebra I
- CST Algebra II
- CST Biology
- CST Chemistry
- CST Earth Science
- CST English-Language Arts
- CST Geometry
- CST Physics
- CST Science
- CST Summative High School Math
- CST U.S. History
- CST World History
AYP Results (2010)
Overall AYP Met: No
ELA AYP Met: No
Math AYP Met: No
ACT Exam Results (2009)
Percent of Students Taking ACT Exam: 19.0%
Average Combined Score: 17.7
Percent Scoring At or Above 21: 15.9%
SAT Exam Results (2009)
Percent of Students Taking SAT Exam: 39.2%
Average Combined Score: 1,242.9
Critical Reading Average: 412.9
Math Average: 421.7
Writing Average: 408.4
Percent Scoring At or Above 1500: 13.2%
CST - Test Proficiency by Grade and Subject
Grade 9 - % of students at or above proficiency
| School | District | State | |
|---|---|---|---|
| CST Algebra I Test | |||
| 2010 | 2.0% | 2.0% | 22.0% |
| 2009 | 9.0% | 9.0% | 21.0% |
| 2008 | 4.0% | 4.0% | 18.0% |
| CST Biology Test | |||
| 2010 | 16.0% | 16.0% | 55.0% |
| 2009 | 12.0% | 12.0% | 51.0% |
| 2008 | 12.0% | 12.0% | 52.0% |
| CST English-Language Arts Test | |||
| 2010 | 39.0% | 38.0% | 54.0% |
| 2009 | 25.0% | 26.0% | 50.0% |
| 2008 | 29.0% | 28.0% | 49.0% |
| CST Geometry Test | |||
| 2010 | 13.0% | 13.0% | 46.0% |
| 2009 | 23.0% | 23.0% | 47.0% |
| 2008 | 11.0% | 11.0% | 43.0% |
| CST World History Test | |||
| 2009 | 12.0% | 13.0% | 41.0% |
Grade 10 - % of students at or above proficiency
| School | District | State | |
|---|---|---|---|
| CST Algebra II Test | |||
| 2010 | 41.0% | 41.0% | 40.0% |
| 2009 | 33.0% | 33.0% | 37.0% |
| 2008 | 22.0% | 22.0% | 36.0% |
| CST Biology Test | |||
| 2010 | 11.0% | 11.0% | 38.0% |
| 2009 | 7.0% | 5.0% | 34.0% |
| 2008 | 19.0% | 16.0% | 35.0% |
| CST Chemistry Test | |||
| 2010 | 25.0% | 25.0% | 47.0% |
| 2009 | 20.0% | 20.0% | 44.0% |
| 2008 | 17.0% | 17.0% | 41.0% |
| CST English-Language Arts Test | |||
| 2010 | 26.0% | 25.0% | 45.0% |
| 2009 | 31.0% | 30.0% | 44.0% |
| 2008 | 22.0% | 20.0% | 41.0% |
| CST Geometry Test | |||
| 2010 | 1.0% | 1.0% | 14.0% |
| 2009 | 4.0% | 4.0% | 14.0% |
| 2008 | 1.0% | 1.0% | 12.0% |
| CST Physics Test | |||
| 2010 | 4.0% | 4.0% | 44.0% |
| 2009 | 5.0% | 5.0% | 40.0% |
| 2008 | 6.0% | 6.0% | 36.0% |
| CST Science Test | |||
| 2010 | 17.0% | 17.0% | 46.0% |
| 2009 | 24.0% | 23.0% | 44.0% |
| 2008 | 18.0% | 16.0% | 40.0% |
| CST World History Test | |||
| 2010 | 18.0% | 17.0% | 42.0% |
| 2009 | 20.0% | 19.0% | 38.0% |
| 2008 | 16.0% | 14.0% | 33.0% |
| CST Algebra I Test | |||
| 2009 | 7.0% | 8.0% | 11.0% |
Grade 11 - % of students at or above proficiency
| School | District | State | |
|---|---|---|---|
| CST Algebra II Test | |||
| 2010 | 5.0% | 5.0% | 14.0% |
| 2009 | 2.0% | 2.0% | 12.0% |
| 2008 | 4.0% | 4.0% | 11.0% |
| CST Biology Test | |||
| 2010 | 32.0% | 28.0% | 46.0% |
| 2009 | 28.0% | 19.0% | 41.0% |
| 2008 | 27.0% | 18.0% | 39.0% |
| CST Chemistry Test | |||
| 2010 | 23.0% | 23.0% | 30.0% |
| 2009 | 36.0% | 36.0% | 27.0% |
| 2008 | 26.0% | 26.0% | 25.0% |
| CST English-Language Arts Test | |||
| 2010 | 32.0% | 27.0% | 42.0% |
| 2009 | 25.0% | 21.0% | 40.0% |
| 2008 | 17.0% | 17.0% | 37.0% |
| CST Summative High School Math Test | |||
| 2010 | 26.0% | 26.0% | 50.0% |
| 2009 | 40.0% | 40.0% | 47.0% |
| 2008 | 22.0% | 22.0% | 43.0% |
| CST U.S. History Test | |||
| 2010 | 35.0% | 30.0% | 45.0% |
| 2009 | 32.0% | 28.0% | 44.0% |
| 2008 | 19.0% | 18.0% | 38.0% |
| CST Physics Test | |||
| 2009 | 8.0% | 7.0% | 50.0% |
| 2008 | 1.0% | 1.0% | 47.0% |
End of Course - % of students at or above proficiency
| School | District | State | |
|---|---|---|---|
| CST Algebra I Test | |||
| 2010 | 1.0% | 9.0% | 31.0% |
| 2009 | 8.0% | 19.0% | 28.0% |
| 2008 | 3.0% | 10.0% | 25.0% |
| CST Algebra II Test | |||
| 2010 | 16.0% | 16.0% | 31.0% |
| 2009 | 11.0% | 11.0% | 28.0% |
| 2008 | 8.0% | 8.0% | 27.0% |
| CST Biology Test | |||
| 2010 | 17.0% | 17.0% | 46.0% |
| 2009 | 12.0% | 12.0% | 42.0% |
| 2008 | 13.0% | 13.0% | 42.0% |
| CST Chemistry Test | |||
| 2010 | 24.0% | 24.0% | 38.0% |
| 2009 | 28.0% | 28.0% | 36.0% |
| 2008 | 21.0% | 21.0% | 32.0% |
| CST Geometry Test | |||
| 2010 | 4.0% | 6.0% | 27.0% |
| 2009 | 8.0% | 9.0% | 26.0% |
| 2008 | 2.0% | 3.0% | 24.0% |
| CST Physics Test | |||
| 2010 | 2.0% | 2.0% | 49.0% |
| 2009 | 5.0% | 5.0% | 46.0% |
| 2008 | 2.0% | 2.0% | 43.0% |
| CST Summative High School Math Test | |||
| 2010 | 26.0% | 26.0% | 54.0% |
| 2009 | 40.0% | 40.0% | 50.0% |
| 2008 | 22.0% | 22.0% | 47.0% |
| CST World History Test | |||
| 2010 | 18.0% | 16.0% | 41.0% |
| 2009 | 18.0% | 17.0% | 38.0% |
| 2008 | 14.0% | 13.0% | 33.0% |
| CST Earth Science Test | |||
| 2008 | 12.0% | 11.0% | 28.0% |
Source: CA Department of Education 2009-2010
School Map and Similar Schools Nearby
Click to Activate Map of Nearby School Campuses
Private
Public
This School
Similar Schools Nearby
| Beaumont High School 9-12 | 2,305 Students | 6.8 miles away | ![]() 3 out of 5 | |
| San Jacinto High School 9-12 | 2,211 Students | 9.9 miles away | Not Yet Rated | |
| San Jacinto Home Education School 1-12 | 270 Students | 10.1 miles away | Not Yet Rated | |
| Tahquitz High School 9-12 | 1,485 Students | 12.3 miles away | Not Yet Rated | - |
| Yucaipa High School Ninth Grade Campus 9 | 780 Students | 13.0 miles away | Not Yet Rated | |
| Hemet High School 9-12 | 2,435 Students | 13.4 miles away | ![]() 4 out of 5 | |
| Yucaipa High School 10-12 | 2,181 Students | 14.4 miles away | Not Yet Rated | |
| West Valley High School 9-12 | 1,896 Students | 15.6 miles away | Not Yet Rated | |
| Redlands East Valley High School 9-12 | 3,094 Students | 17.4 miles away | ![]() 5 out of 5 | |
| Valley View High School 9-12 | 2,815 Students | 18.0 miles away | ![]() 2.5 out of 5 | |
Compare This School To Nearby Schools ->
School Community Forum

Join a discussion about Banning High School and talk to others in the community including students, parents, teachers, and administrators.
Popular Discussion Topics
- Admissions and Registration Questions (e.g. Dress Code and Discipline Policy)
- School Calendar and Upcoming Events (e.g. Graduation)
- After School Programs, Extracurricular Activities, and Athletics (e.g. Football)
- News and Announcements (e.g. Yearbook and Class Supply List Details)
- Graduate and Alumni Events (e.g. Organizing Class Reunions)
Navigation
Can't Find What You Are Looking For?
Rankings
Nearby Cities
Sponsored Links
K-12 Articles
Break the Cycle: Teen Dating Violence and Prevention Week
February 5 through 9 was "National Teen Dating Violence Awareness and Prevention Week"....
Everyone Loves Going to the Doctor and Dentist
Going to the doctor or dentist can be traumatic for children of all ages. Many adults do not...
Teaching Your Kids About Respect, Values and Violence
These days it seems that every newscast reports at least once incident of violence. As parents, we...


