Bellflower High School
Rating
Not Available
Not Available

5 out of 5 | 1 Review
Find Old Friends From Bellflower High School
Use the form below to search for alumni from Bellflower High School.
School Description
School Summary and Highlights
- Enrolls 3,116 middle and high school students from grades 7-12
- Ranks 332nd out of 1,197 high schools in CA.
- 2010 Overall School AYP Met Status: No
Additional Contact Information
- Mailing Address: 16703 South Clark Ave., Bellflower, CA 90706
School District Details
- Bellflower Unified School District
- Per-Pupil Spending: $8,737
- Graduation Rate: 76.7%
- Dropout Rate: 3.0%
- Students Per Teacher: 22.0
- Enrolled Students: 14,360
Faculty Details and Student Enrollment
Students and Faculty
- Total Students Enrolled: 3,116
- Total Full Time "Equivalent" Teachers: 138.9
- Average Student-To-Teacher Ratio: 22.4
Students Gender Breakdown
- Males: 1,592 (51.1%)
- Females: 1,524 (48.9%)
Free Lunch Student Eligibility Breakdown
- Eligible for Reduced Lunch: 545 (17.5%)
- Eligible for Free Lunch: 1,505 (48.3%)
- Eligible for Either Reduced or Free Lunch: 2,050 (65.8%)
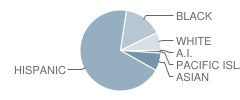
Student Enrollment Distribution by Race / Ethnicity
| Number | Percent | |
|---|---|---|
| American Indian | 3 | 0.10% |
| Black | 469 | 15.1% |
| Asian | 216 | 6.9% |
| Hispanic | 2,106 | 67.6% |
| White | 220 | 7.1% |
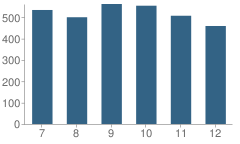
Number of Students Per Grade
| Number | Percent | |
|---|---|---|
| 7th Grade | 534 | 17.1% |
| 8th Grade | 500 | 16.0% |
| 9th Grade | 562 | 18.0% |
| 10th Grade | 554 | 17.8% |
| 11th Grade | 507 | 16.3% |
| 12th Grade | 459 | 14.7% |
Graduates Information (2010)
Graduation Rate
School:
91.6%
District:
85.5%
State:
78.6%
Teacher Education Background (2009)
Percent With Master's Degree
School:
20.0%
District:
30.8%
Percent With Bachelor's Degree
School:
17.9%
District:
3.8%
Teacher Credentials & Experience (2009)
Percent of Teachers With Emergency Credentials: 0.8%
Percent of Teachers With Credentials: 91.0%
Number of Certificated Staff: 145.0
Average Number of Years of Teacher Experience: 10.9
Average Age
School:
41.6
District:
47.8
Source: CA Department of Education, Source: NCES 2009-2010
School Ratings and Reviews
Overall Rating: 5

5 out of 5 | 1 Review
The Overall Rating is the school's average rating from parents, students, school faculty and staff. The highest rating is five apples and the lowest is one apple.
Share Your Review About This School
1 review for Bellflower High School
- Reviewed by Student on October 21, 2009
- Rating:
 (5 / 5) Flag as inappropriate
 - Best school go ms rios
School Map and Similar Schools Nearby
Click to Activate Map of Nearby School Campuses
Private
Public
This School
Similar Schools Nearby
| Norwalk High School 9-12 | 2,321 Students | 1.7 miles away |  3 out of 5 | |
| Richard Gahr High School 9-12 | 2,058 Students | 1.7 miles away |  5 out of 5 | |
| Mayfair High School 7-12 | 3,579 Students | 2.0 miles away | Not Yet Rated | |
| Paramount High School 9-12 | 4,758 Students | 2.2 miles away | Not Yet Rated | |
| Downey High School 9-12 | 4,016 Students | 3.2 miles away | Not Yet Rated | |
| Warren High School 9-12 | 3,666 Students | 3.2 miles away |  4 out of 5 | |
| Cerritos High School 9-12 | 2,134 Students | 3.4 miles away | Not Yet Rated | |
| Gretchen Whitney High School 7-12 | 1,022 Students | 3.6 miles away | Not Yet Rated | |
| John H. Glenn High School 9-12 | 1,871 Students | 3.6 miles away | Not Yet Rated | |
| Santa Fe High School 9-12 | 2,932 Students | 3.6 miles away | 5 out of 5 | |
Compare This School To Nearby Schools ->
School Community Forum

Join a discussion about Bellflower High School and talk to others in the community including students, parents, teachers, and administrators.
Popular Discussion Topics
- Admissions and Registration Questions (e.g. Dress Code and Discipline Policy)
- School Calendar and Upcoming Events (e.g. Graduation)
- After School Programs, Extracurricular Activities, and Athletics (e.g. Football)
- News and Announcements (e.g. Yearbook and Class Supply List Details)
- Graduate and Alumni Events (e.g. Organizing Class Reunions)
Navigation
Can't Find What You Are Looking For?
Rankings
Nearby Cities
Sponsored Links
K-12 Articles

Who is Safe?
Between September 26 and October 2, 2006, there were three deadly school shootings and...
Between September 26 and October 2, 2006, there were three deadly school shootings and...

Public or Private?
Daniel attended private school until sixth grade, when he was diagnosed with Asperger's Syndrome, a...
Daniel attended private school until sixth grade, when he was diagnosed with Asperger's Syndrome, a...

Teachers Packing Heat
After the recent school shootings (and thwarted school shootings) in the past month-just as after...
After the recent school shootings (and thwarted school shootings) in the past month-just as after...