Ramona Elementary School
Rating
Not Available
Not Available

5 out of 5 | 1 Review
Find Old Friends From Ramona Elementary School
Use the form below to search for alumni from Ramona Elementary School.
School Description
School Summary and Highlights
- Enrolls 706 elementary school students from grades KG-6
- Ranks 3921st out of 5,423 elementary schools in CA.
- 2010 Overall School AYP Met Status: No
Additional Contact Information
- Mailing Address: 16703 South Clark Ave., Bellflower, CA 90706
School Operational Details
- Title I Eligible
School District Details
- Bellflower Unified School District
- Per-Pupil Spending: $8,737
- Graduation Rate: 76.7%
- Dropout Rate: 3.0%
- Students Per Teacher: 22.0
- Enrolled Students: 14,360
Faculty Details and Student Enrollment
Students and Faculty
- Total Students Enrolled: 706
- Total Full Time "Equivalent" Teachers: 34.0
- Average Student-To-Teacher Ratio: 20.8
Students Gender Breakdown
- Males: 355 (50.3%)
- Females: 351 (49.7%)
Free Lunch Student Eligibility Breakdown
- Eligible for Reduced Lunch: 156 (22.1%)
- Eligible for Free Lunch: 426 (60.3%)
- Eligible for Either Reduced or Free Lunch: 582 (82.4%)
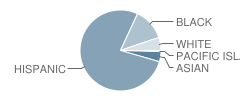
Student Enrollment Distribution by Race / Ethnicity
| Number | Percent | |
|---|---|---|
| American Indian | - | - |
| Black | 89 | 12.6% |
| Asian | 28 | 4.0% |
| Hispanic | 535 | 75.8% |
| White | 36 | 5.1% |
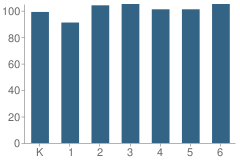
Number of Students Per Grade
| Number | Percent | |
|---|---|---|
| Kindergarten | 99 | 14.0% |
| 1st Grade | 91 | 12.9% |
| 2nd Grade | 104 | 14.7% |
| 3rd Grade | 105 | 14.9% |
| 4th Grade | 101 | 14.3% |
| 5th Grade | 101 | 14.3% |
| 6th Grade | 105 | 14.9% |
Teacher Education Background (2009)
Percent With Master's Degree
School:
15.8%
District:
30.8%
Percent With Bachelor's Degree
School:
2.6%
District:
3.8%
Teacher Credentials & Experience (2009)
Percent of Teachers With Credentials: 97.0%
Number of Certificated Staff: 38.0
Average Number of Years of Teacher Experience: 12.8
Average Age
School:
42.6
District:
47.8
Source: CA Department of Education, Source: NCES 2009-2010
School Ratings and Reviews
Overall Rating: 5

5 out of 5 | 1 Review
The Overall Rating is the school's average rating from parents, students, school faculty and staff. The highest rating is five apples and the lowest is one apple.
Share Your Review About This School
1 review for Ramona Elementary School
- Reviewed by Teacher on July 15, 2007
- Rating:
 (5 / 5) Flag as inappropriate
 - Ramona Elementary is a school where students feel welcomed and safe. Teachers are involved and strive to help their students in every way they can. Special events add to the fun of the educational experience at Ramona Elementary. Performing arts are supported through plays, poetry recitals, musicals, and annual programs. Fabulous assemblies and fun and educational field trips help students learn about the world around them. Join in the Ramona experience.
School Map and Similar Schools Nearby
Click to Activate Map of Nearby School Campuses
Private
Public
This School
Similar Schools Nearby
| Major Lynn Mokler School KG-5 | 644 Students | 0.8 miles away |  5 out of 5 | |
| Washington Elementary School KG-6 | 880 Students | 0.9 miles away | 5 out of 5 | |
| Las Flores Elementary School KG-6 | 218 Students | 1.0 miles away | Not Yet Rated | |
| Jefferson Elementary School KG-5 | 478 Students | 1.0 miles away | Not Yet Rated | |
| Albert Baxter Elementary School KG-6 | 554 Students | 1.1 miles away | Not Yet Rated | |
| Frank E. Woodruff Elementary School KG-6 | 711 Students | 1.1 miles away | Not Yet Rated | |
| Craig Williams Elementary School KG-6 | 755 Students | 1.1 miles away | Not Yet Rated | |
| Thomas Jefferson Elementary School KG-6 | 693 Students | 1.3 miles away |  4 out of 5 | |
| Captain Raymond Collins School KG-5 | 666 Students | 1.3 miles away | 5 out of 5 | |
| Mckinley Elementary School KG-5 | 768 Students | 1.4 miles away | 5 out of 5 | |
Compare This School To Nearby Schools ->
School Community Forum

Join a discussion about Ramona Elementary School and talk to others in the community including students, parents, teachers, and administrators.
Popular Discussion Topics
- Admissions and Registration Questions (e.g. Dress Code and Discipline Policy)
- School Calendar and Upcoming Events (e.g. Graduation)
- After School Programs, Extracurricular Activities, and Athletics (e.g. Football)
- News and Announcements (e.g. Yearbook and Class Supply List Details)
- Graduate and Alumni Events (e.g. Organizing Class Reunions)
Navigation
Can't Find What You Are Looking For?
Rankings
Nearby Cities
Sponsored Links
K-12 Articles

Cut the Credit and Save You Some Money
Today’s society glorifies a get-it-now mentality. Children learn this early. You probably noticed...
Today’s society glorifies a get-it-now mentality. Children learn this early. You probably noticed...

Making Sense of No Child Left Behind
The No Child Left Behind Act of 2001 has met with mixed results and mixed feelings. Some think it...
The No Child Left Behind Act of 2001 has met with mixed results and mixed feelings. Some think it...

Those Pesky Little Transitions
Transitions are rarely easy, yet we have to encounter them every day of our lives. For school-aged...
Transitions are rarely easy, yet we have to encounter them every day of our lives. For school-aged...