Benicia High School

No Reviews Yet
Find Old Friends From Benicia High School
Use the form below to search for alumni from Benicia High School.
School Description
School Summary and Highlights
- Enrolls 1,671 high school students from grades 9-12
- Ranks 68th out of 1,197 high schools in CA.
- 2010 Overall School AYP Met Status: Yes
School District Details
- Benicia Unified School District
- Per-Pupil Spending: $8,035
- Graduation Rate: 54.2%
- Dropout Rate: 3.4%
- Students Per Teacher: 21.6
- Enrolled Students: 4,993
Faculty Details and Student Enrollment
Students and Faculty
- Total Students Enrolled: 1,671
- Total Full Time "Equivalent" Teachers: 75.4
- Average Student-To-Teacher Ratio: 22.2
Students Gender Breakdown
- Males: 833 (49.9%)
- Females: 838 (50.1%)
Free Lunch Student Eligibility Breakdown
- Eligible for Reduced Lunch: 39 (2.3%)
- Eligible for Free Lunch: 132 (7.9%)
- Eligible for Either Reduced or Free Lunch: 171 (10.2%)
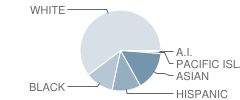
Student Enrollment Distribution by Race / Ethnicity

| Number | Percent | |
|---|---|---|
| American Indian | 12 | 0.7% |
| Black | 185 | 11.1% |
| Asian | 254 | 15.2% |
| Hispanic | 187 | 11.2% |
| White | 969 | 58.0% |
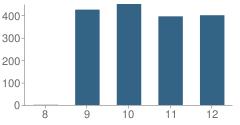
Number of Students Per Grade

| Number | Percent | |
|---|---|---|
| 8th Grade | 1 | 0.06% |
| 9th Grade | 425 | 25.4% |
| 10th Grade | 450 | 26.9% |
| 11th Grade | 395 | 23.6% |
| 12th Grade | 400 | 23.9% |
Graduates Information (2010)
Graduation Rate
School:
89.4%
District:
89.3%
State:
78.6%
Teacher Education Background (2009)
Percent With Ph.D.
School:
3.2%
District:
10.0%
Percent With Master's Degree
School:
16.8%
District:
30.0%
Percent With Bachelor's Degree
School:
13.7%
District:
10.0%
Teacher Credentials & Experience (2009)
Percent of Teachers With Credentials: 98.9%
Number of Certificated Staff: 95.0
Average Number of Years of Teacher Experience: 15.0
Average Age
School:
45.0
District:
47.2
Source: CA Department of Education, Source: NCES 2009-2010
School Ratings and Reviews
Be The First To Review Benicia High School!
Sponsored Links
Test Scores and Performance Information
Overall School Rating
How is this determined?
The overall school rating shows that Benicia High School performed on average much better than most other schools across the state on CST state exams in the following subjects:
- CST Algebra I
- CST Algebra II
- CST Biology
- CST Chemistry
- CST Earth Science
- CST English-Language Arts
- CST General Mathematics
- CST Geometry
- CST Integrated/Coordinated Science
- CST Science
- CST Summative High School Math
- CST U.S. History
- CST World History
AYP Results (2010)
Overall AYP Met: Yes
ELA AYP Met: Yes
Math AYP Met: Yes
ACT Exam Results (2009)
Percent of Students Taking ACT Exam: 21.8%
Average Combined Score: 25.0
Percent Scoring At or Above 21: 84.6%
SAT Exam Results (2009)
Percent of Students Taking SAT Exam: 50.0%
Average Combined Score: 1,651.5
Critical Reading Average: 544.0
Math Average: 579.0
Writing Average: 528.5
Percent Scoring At or Above 1500: 74.2%
CST - Test Proficiency by Grade and Subject
Grade 9 - % of students at or above proficiency
| School | District | State | |
|---|---|---|---|
| CST Algebra I Test | |||
| 2010 | 48.0% | 48.0% | 22.0% |
| 2009 | 37.0% | 37.0% | 21.0% |
| 2008 | 28.0% | 28.0% | 18.0% |
| CST English-Language Arts Test | |||
| 2010 | 73.0% | 73.0% | 54.0% |
| 2009 | 74.0% | 73.0% | 50.0% |
| 2008 | 71.0% | 71.0% | 49.0% |
| CST General Mathematics Test | |||
| 2010 | 36.0% | 36.0% | 17.0% |
| 2009 | 28.0% | 31.0% | 17.0% |
| 2008 | 26.0% | 26.0% | 18.0% |
| CST Geometry Test | |||
| 2010 | 83.0% | 83.0% | 46.0% |
| 2009 | 81.0% | 81.0% | 47.0% |
| 2008 | 74.0% | 74.0% | 43.0% |
| CST Integrated/Coordinated Science Test | |||
| 2010 | 37.0% | 37.0% | 19.0% |
| 2009 | 31.0% | 31.0% | 15.0% |
| 2008 | 36.0% | 36.0% | 5.0% |
| CST Algebra II Test | |||
| 2009 | 92.0% | 92.0% | 65.0% |
| 2008 | 95.0% | 95.0% | 66.0% |
Grade 10 - % of students at or above proficiency
| School | District | State | |
|---|---|---|---|
| CST Algebra I Test | |||
| 2010 | 35.0% | 34.0% | 12.0% |
| 2009 | 19.0% | 18.0% | 11.0% |
| 2008 | 15.0% | 15.0% | 9.0% |
| CST Algebra II Test | |||
| 2010 | 59.0% | 59.0% | 40.0% |
| 2009 | 53.0% | 53.0% | 37.0% |
| 2008 | 50.0% | 50.0% | 36.0% |
| CST Biology Test | |||
| 2010 | 61.0% | 61.0% | 38.0% |
| 2009 | 59.0% | 59.0% | 34.0% |
| 2008 | 52.0% | 52.0% | 35.0% |
| CST English-Language Arts Test | |||
| 2010 | 66.0% | 65.0% | 45.0% |
| 2009 | 64.0% | 64.0% | 44.0% |
| 2008 | 58.0% | 58.0% | 41.0% |
| CST Geometry Test | |||
| 2010 | 39.0% | 39.0% | 14.0% |
| 2009 | 27.0% | 27.0% | 14.0% |
| 2008 | 30.0% | 30.0% | 12.0% |
| CST Science Test | |||
| 2010 | 66.0% | 65.0% | 46.0% |
| 2009 | 68.0% | 68.0% | 44.0% |
| 2008 | 56.0% | 56.0% | 40.0% |
| CST World History Test | |||
| 2010 | 62.0% | 61.0% | 42.0% |
| 2009 | 57.0% | 57.0% | 38.0% |
| 2008 | 47.0% | 47.0% | 33.0% |
| CST Summative High School Math Test | |||
| 2009 | 100.0% | 100.0% | 71.0% |
| 2008 | 92.0% | 92.0% | 68.0% |
Grade 11 - % of students at or above proficiency
| School | District | State | |
|---|---|---|---|
| CST Algebra I Test | |||
| 2010 | 6.0% | 6.0% | 8.0% |
| 2009 | 16.0% | 11.0% | 8.0% |
| 2008 | 15.0% | 7.0% | 5.0% |
| CST Algebra II Test | |||
| 2010 | 27.0% | 27.0% | 14.0% |
| 2009 | 27.0% | 27.0% | 12.0% |
| 2008 | 37.0% | 37.0% | 11.0% |
| CST Chemistry Test | |||
| 2010 | 72.0% | 72.0% | 30.0% |
| 2009 | 56.0% | 56.0% | 27.0% |
| 2008 | 66.0% | 66.0% | 25.0% |
| CST English-Language Arts Test | |||
| 2010 | 65.0% | 60.0% | 42.0% |
| 2009 | 59.0% | 55.0% | 40.0% |
| 2008 | 61.0% | 56.0% | 37.0% |
| CST Geometry Test | |||
| 2010 | 28.0% | 28.0% | 6.0% |
| 2009 | 17.0% | 17.0% | 7.0% |
| 2008 | 14.0% | 14.0% | 6.0% |
| CST Summative High School Math Test | |||
| 2010 | 72.0% | 72.0% | 50.0% |
| 2009 | 69.0% | 69.0% | 47.0% |
| 2008 | 65.0% | 65.0% | 43.0% |
| CST U.S. History Test | |||
| 2010 | 62.0% | 56.0% | 45.0% |
| 2009 | 57.0% | 54.0% | 44.0% |
| 2008 | 57.0% | 52.0% | 38.0% |
| CST Earth Science Test | |||
| 2009 | 35.0% | 35.0% | 26.0% |
| 2008 | 43.0% | 43.0% | 28.0% |
| CST Biology Test | |||
| 2008 | 50.0% | 49.0% | 39.0% |
End of Course - % of students at or above proficiency
| School | District | State | |
|---|---|---|---|
| CST Algebra I Test | |||
| 2010 | 40.0% | 54.0% | 31.0% |
| 2009 | 31.0% | 45.0% | 28.0% |
| 2008 | 21.0% | 34.0% | 25.0% |
| CST Algebra II Test | |||
| 2010 | 47.0% | 47.0% | 31.0% |
| 2009 | 46.0% | 46.0% | 28.0% |
| 2008 | 49.0% | 49.0% | 27.0% |
| CST Biology Test | |||
| 2010 | 61.0% | 60.0% | 46.0% |
| 2009 | 58.0% | 58.0% | 42.0% |
| 2008 | 52.0% | 51.0% | 42.0% |
| CST Chemistry Test | |||
| 2010 | 72.0% | 72.0% | 38.0% |
| 2009 | 58.0% | 58.0% | 36.0% |
| 2008 | 66.0% | 66.0% | 32.0% |
| CST General Mathematics Test | |||
| 2010 | 36.0% | 44.0% | 27.0% |
| 2009 | 28.0% | 42.0% | 26.0% |
| 2008 | 26.0% | 41.0% | 27.0% |
| CST Geometry Test | |||
| 2010 | 52.0% | 52.0% | 27.0% |
| 2009 | 46.0% | 46.0% | 26.0% |
| 2008 | 43.0% | 45.0% | 24.0% |
| CST Integrated/Coordinated Science Test | |||
| 2010 | 37.0% | 36.0% | 16.0% |
| 2009 | 31.0% | 30.0% | 13.0% |
| 2008 | 35.0% | 32.0% | 11.0% |
| CST Summative High School Math Test | |||
| 2010 | 75.0% | 75.0% | 54.0% |
| 2009 | 73.0% | 73.0% | 50.0% |
| 2008 | 71.0% | 71.0% | 47.0% |
| CST World History Test | |||
| 2010 | 61.0% | 59.0% | 41.0% |
| 2009 | 57.0% | 55.0% | 38.0% |
| 2008 | 45.0% | 41.0% | 33.0% |
| CST Earth Science Test | |||
| 2009 | 33.0% | 32.0% | 28.0% |
| 2008 | 33.0% | 33.0% | 28.0% |
Source: CA Department of Education 2009-2010
School Map and Similar Schools Nearby
Click to Activate Map of Nearby School Campuses
Private
Public
This School
Similar Schools Nearby
| John Swett High School 9-12 | 524 Students | 2.7 miles away | Not Yet Rated | |
| Hogan High School 9-12 | 1,361 Students | 3.5 miles away | ![]() 3.5 out of 5 | |
| Martinez Junior High School 6-8 | 918 Students | 4.0 miles away | Not Yet Rated | |
| Jesse M. Bethel High School 9-12 | 1,494 Students | 4.0 miles away | ![]() 4 out of 5 | |
| Alhambra High School 9-12 | 1,280 Students | 4.7 miles away | ![]() 5 out of 5 | |
| Vallejo High School 9-12 | 1,666 Students | 5.2 miles away | ![]() 3 out of 5 | |
| Hercules High School 9-12 | 1,008 Students | 6.1 miles away | ![]() 3 out of 5 | |
| Pinole Valley High School 9-12 | 1,622 Students | 7.9 miles away | Not Yet Rated | |
| College Park High School 9-12 | 2,034 Students | 8.8 miles away | Not Yet Rated | |
| De Anza High School 9-12 | 907 Students | 9.0 miles away | ![]() 5 out of 5 | |
Compare This School To Nearby Schools ->
School Community Forum

Join a discussion about Benicia High School and talk to others in the community including students, parents, teachers, and administrators.
Popular Discussion Topics
- Admissions and Registration Questions (e.g. Dress Code and Discipline Policy)
- School Calendar and Upcoming Events (e.g. Graduation)
- After School Programs, Extracurricular Activities, and Athletics (e.g. Football)
- News and Announcements (e.g. Yearbook and Class Supply List Details)
- Graduate and Alumni Events (e.g. Organizing Class Reunions)
Navigation
Can't Find What You Are Looking For?
Rankings
Nearby Cities
Sponsored Links
K-12 Articles
School Violence: Can It Be Stopped
It's a fact that violence in schools is prevalent in today's society. We hear of school shootings,...
Teachers Packing Heat
After the recent school shootings (and thwarted school shootings) in the past month-just as after...
The First Day of School
The first day of kindergarten is a rite of passage for any student. Every mother cries and...


