Georgetown Elementary School
6530 Westworth Springs Rd, Georgetown, CA 95634 | (530) 333-8320
- Grades: KG-8
- Student Enrollment: 484
Rating
Not Available
Not Available

No Reviews Yet
Find Old Friends From Georgetown Elementary School
Use the form below to search for alumni from Georgetown Elementary School.
School Description
School Summary and Highlights
- Enrolls 484 elementary school students from grades KG-8
- Ranks 741st out of 2,050 middle schools in CA.
- 2010 Overall School AYP Met Status: No
Additional Contact Information
- Mailing Address: PO Box 4630, Georgetown, CA 95634
School Operational Details
- Title I Eligible
School District Details
- Black Oak Mine Unified School District
- Per-Pupil Spending: $8,955
- Graduation Rate: 91.8%
- Dropout Rate: 1.3%
- Students Per Teacher: 20.3
- Enrolled Students: 1,639
Faculty Details and Student Enrollment
Students and Faculty
- Total Students Enrolled: 484
- Total Full Time "Equivalent" Teachers: 23.6
- Average Student-To-Teacher Ratio: 20.5
Students Gender Breakdown
- Males: 259 (53.5%)
- Females: 225 (46.5%)
Free Lunch Student Eligibility Breakdown
- Eligible for Reduced Lunch: 46 (9.5%)
- Eligible for Free Lunch: 205 (42.4%)
- Eligible for Either Reduced or Free Lunch: 251 (51.9%)
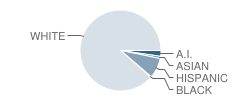
Student Enrollment Distribution by Race / Ethnicity
| Number | Percent | |
|---|---|---|
| American Indian | 11 | 2.3% |
| Black | 1 | 0.2% |
| Asian | 4 | 0.8% |
| Hispanic | 38 | 7.9% |
| White | 416 | 86.0% |
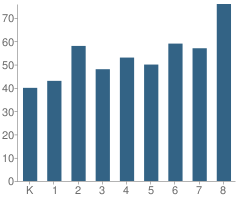
Number of Students Per Grade
| Number | Percent | |
|---|---|---|
| Kindergarten | 40 | 8.3% |
| 1st Grade | 43 | 8.9% |
| 2nd Grade | 58 | 12.0% |
| 3rd Grade | 48 | 9.9% |
| 4th Grade | 53 | 11.0% |
| 5th Grade | 50 | 10.3% |
| 6th Grade | 59 | 12.2% |
| 7th Grade | 57 | 11.8% |
| 8th Grade | 76 | 15.7% |
Teacher Education Background (2009)
Percent With Bachelor's Degree
School:
11.5%
District:
14.3%
Teacher Credentials & Experience (2009)
Percent of Teachers With Credentials: 100.0%
Number of Certificated Staff: 26.0
Average Number of Years of Teacher Experience: 18.3
Average Age
School:
49.1
District:
52.7
Source: CA Department of Education, Source: NCES 2009-2010
School Ratings and Reviews
Be The First To Review Georgetown Elementary School!
School Map and Similar Schools Nearby
Click to Activate Map of Nearby School Campuses
Private
Public
This School
Similar Schools Nearby
| Foresthill Divide Middle School 5-8 | 229 Students | 6.9 miles away | Not Yet Rated | |
| Otter Creek Elementary School KG-5 | 27 Students | 7.5 miles away | Not Yet Rated | - |
| Foresthill Elementary School KG-4 | 251 Students | 7.7 miles away | Not Yet Rated | |
| Gold Trail School 4-8 | 320 Students | 10.0 miles away | Not Yet Rated | |
| Northside Elementary School KG-8 | 519 Students | 10.4 miles away | Not Yet Rated | |
| Sutter's Mill Primary School KG-3 | 220 Students | 11.1 miles away | Not Yet Rated | |
| Sierra Hills Elementary School KG-3 | 406 Students | 11.7 miles away | Not Yet Rated | |
| Weimar Hills School 4-8 | 650 Students | 12.1 miles away | Not Yet Rated | |
| Louisiana Schnell Elementary School KG-5 | 382 Students | 12.6 miles away | Not Yet Rated | |
| Sierra Elementary School KG-5 | 449 Students | 12.8 miles away | Not Yet Rated | |
Compare This School To Nearby Schools ->
School Community Forum

Join a discussion about Georgetown Elementary School and talk to others in the community including students, parents, teachers, and administrators.
Popular Discussion Topics
- Admissions and Registration Questions (e.g. Dress Code and Discipline Policy)
- School Calendar and Upcoming Events (e.g. Graduation)
- After School Programs, Extracurricular Activities, and Athletics (e.g. Football)
- News and Announcements (e.g. Yearbook and Class Supply List Details)
- Graduate and Alumni Events (e.g. Organizing Class Reunions)
Navigation
Can't Find What You Are Looking For?
Rankings
Nearby Cities
Sponsored Links
K-12 Articles

Homework Tips: Taking the Work out of Homework
Kids hate homework. It seems that almost every night of the week they are overloaded with...
Kids hate homework. It seems that almost every night of the week they are overloaded with...

Asperger Syndrome: A Developmental Disorder on the Autism Spectrum
Asperger Syndrome, also known as Pervasive Developmental Disorder is on the high functioning end of...
Asperger Syndrome, also known as Pervasive Developmental Disorder is on the high functioning end of...

Special Needs Education: Your Child, Your Rights
Many children today have special needs that make it difficult for them to learn. It's imperative...
Many children today have special needs that make it difficult for them to learn. It's imperative...