Borrego Springs High School
Rating
Not Available
Not Available

No Reviews Yet
Find Old Friends From Borrego Springs High School
Use the form below to search for alumni from Borrego Springs High School.
School Description
School Summary and Highlights
- Enrolls 150 high school students from grades 9-12
- Ranks 936th out of 1,197 high schools in CA.
- 2010 Overall School AYP Met Status: Yes
Additional Contact Information
- Mailing Address: 1315 Palm Canyon Dr., Borrego Springs, CA 92004
School Operational Details
- Title I Eligible
School District Details
- Borrego Springs Unified School District
- Per-Pupil Spending: $14,099
- Graduation Rate: 80.0%
- Dropout Rate: 2.6%
- Students Per Teacher: 16.4
- Enrolled Students: 535
Faculty Details and Student Enrollment
Students and Faculty
- Total Students Enrolled: 150
- Total Full Time "Equivalent" Teachers: 7.0
- Average Student-To-Teacher Ratio: 21.4
Students Gender Breakdown
- Males: 71 (47.3%)
- Females: 79 (52.7%)
Free Lunch Student Eligibility Breakdown
- Eligible for Reduced Lunch: 18 (12.0%)
- Eligible for Free Lunch: 99 (66.0%)
- Eligible for Either Reduced or Free Lunch: 117 (78.0%)
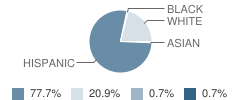
Student Enrollment Distribution by Race / Ethnicity
| Number | Percent | |
|---|---|---|
| American Indian | - | - |
| Black | 1 | 0.7% |
| Asian | 1 | 0.7% |
| Hispanic | 115 | 76.7% |
| White | 31 | 20.7% |
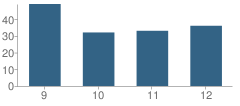
Number of Students Per Grade
| Number | Percent | |
|---|---|---|
| 9th Grade | 49 | 32.7% |
| 10th Grade | 32 | 21.3% |
| 11th Grade | 33 | 22.0% |
| 12th Grade | 36 | 24.0% |
Teacher Education Background (2009)
Percent With Master's Degree: 18.2%
Teacher Credentials & Experience (2009)
Percent of Teachers With Emergency Credentials: 10.0%
Percent of Teachers With Credentials: 70.0%
Number of Certificated Staff: 11.0
Average Number of Years of Teacher Experience: 10.1
Average Age
School:
41.3
District:
57.0
Source: CA Department of Education, Source: NCES 2009-2010
School Ratings and Reviews
Be The First To Review Borrego Springs High School!
School Map and Similar Schools Nearby
Click to Activate Map of Nearby School Campuses
Private
Public
This School
Similar Schools Nearby
| Warner Junior / Senior High School 6-12 | 91 Students | 17.6 miles away | Not Yet Rated | |
| Julian High School 9-12 | 162 Students | 17.9 miles away | Not Yet Rated | |
| Julian Junior High School 7-8 | 86 Students | 17.9 miles away | Not Yet Rated | |
| Desert Mirage High School 9-12 | 1,881 Students | 24.5 miles away |  5 out of 5 | |
| West Shores High School 7-12 | 396 Students | 25.1 miles away |  2 out of 5 | |
| Hamilton High School 9-12 | 393 Students | 26.4 miles away | Not Yet Rated | |
| Coachella Valley High School 9-12 | 2,786 Students | 28.0 miles away | Not Yet Rated | |
Compare This School To Nearby Schools ->
School Community Forum

Join a discussion about Borrego Springs High School and talk to others in the community including students, parents, teachers, and administrators.
Popular Discussion Topics
- Admissions and Registration Questions (e.g. Dress Code and Discipline Policy)
- School Calendar and Upcoming Events (e.g. Graduation)
- After School Programs, Extracurricular Activities, and Athletics (e.g. Football)
- News and Announcements (e.g. Yearbook and Class Supply List Details)
- Graduate and Alumni Events (e.g. Organizing Class Reunions)
Navigation
Can't Find What You Are Looking For?
Rankings
Nearby Cities
Sponsored Links
K-12 Articles

Helping Your Learning Disabled Child
Thousands of children in America struggle to learn on a daily basis. Many of them have invisible...
Thousands of children in America struggle to learn on a daily basis. Many of them have invisible...

Bullycide: What is It and How Can It Be Prevented?
Disclaimer: This article expresses my opinion that has been formed by personal experience and...
Disclaimer: This article expresses my opinion that has been formed by personal experience and...

Choosing a Summer Camp for Your Child
Are you planning to send your child to summer camp this year? If so, have you taken his needs into...
Are you planning to send your child to summer camp this year? If so, have you taken his needs into...