Briggs Elementary School
Rating
Not Available
Not Available

No Reviews Yet
Find Old Friends From Briggs Elementary School
Use the form below to search for alumni from Briggs Elementary School.
School Description
School Summary and Highlights
- Enrolls 258 elementary school students from grades 4-8
- Ranks 1138th out of 2,050 middle schools in CA.
- 2010 Overall School AYP Met Status: No
Additional Contact Information
- Mailing Address: 14438 West Telegraph Rd., Santa Paula, CA 93060
School Operational Details
- Title I EligibleAll students of this school are eligible for participation in authorized programs.
School District Details
- Briggs Elementary School District
- Per-Pupil Spending: $8,915
- Students Per Teacher: 26.3
- Enrolled Students: 513
Faculty Details and Student Enrollment
Students and Faculty
- Total Students Enrolled: 258
- Total Full Time "Equivalent" Teachers: 10.6
- Average Student-To-Teacher Ratio: 24.3
Students Gender Breakdown
- Males: 124 (48.1%)
- Females: 134 (51.9%)
Free Lunch Student Eligibility Breakdown
- Eligible for Reduced Lunch: 76 (29.5%)
- Eligible for Free Lunch: 142 (55.0%)
- Eligible for Either Reduced or Free Lunch: 218 (84.5%)
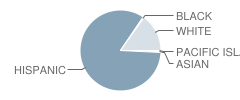
Student Enrollment Distribution by Race / Ethnicity
| Number | Percent | |
|---|---|---|
| American Indian | - | - |
| Black | 1 | 0.4% |
| Asian | 1 | 0.4% |
| Hispanic | 216 | 83.7% |
| White | 39 | 15.1% |
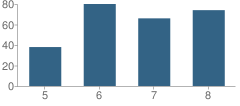
Number of Students Per Grade
| Number | Percent | |
|---|---|---|
| 5th Grade | 38 | 14.7% |
| 6th Grade | 80 | 31.0% |
| 7th Grade | 66 | 25.6% |
| 8th Grade | 74 | 28.7% |
Teacher Education Background (2009)
Percent With Master's Degree
School:
8.3%
District:
50.0%
Percent With Bachelor's Degree: 33.3%
Teacher Credentials & Experience (2009)
Percent of Teachers With Credentials: 100.0%
Number of Certificated Staff: 12.0
Average Number of Years of Teacher Experience: 8.5
Average Age
School:
43.9
District:
47.0
Source: CA Department of Education, Source: NCES 2009-2010
School Ratings and Reviews
Be The First To Review Briggs Elementary School!
School Map and Similar Schools Nearby
Click to Activate Map of Nearby School Campuses
Private
Public
This School
Similar Schools Nearby
| Blanchard Elementary School KG-5 | 472 Students | 1.5 miles away | Not Yet Rated | |
| Glen City Elementary School KG-5 | 615 Students | 1.9 miles away | Not Yet Rated | |
| Olivelands Elementary School KG-4 | 255 Students | 2.1 miles away | Not Yet Rated | |
| Mckevett Elementary School KG-5 | 365 Students | 3.2 miles away | Not Yet Rated | |
| Grace S. Thille Elementary School KG-5 | 338 Students | 3.3 miles away | Not Yet Rated | |
| Barbara Webster Elementary School KG-5 | 441 Students | 3.5 miles away |  5 out of 5 | |
| Thelma B. Bedell Elementary School KG-5 | 348 Students | 4.0 miles away | Not Yet Rated | |
| Saticoy Elementary School KG-5 | 409 Students | 4.3 miles away | Not Yet Rated | |
| Mupu Elementary School KG-8 | 132 Students | 4.4 miles away | Not Yet Rated | |
| Mesa Elementary School KG-8 | 604 Students | 4.6 miles away | Not Yet Rated | |
Compare This School To Nearby Schools ->
School Community Forum

Join a discussion about Briggs Elementary School and talk to others in the community including students, parents, teachers, and administrators.
Popular Discussion Topics
- Admissions and Registration Questions (e.g. Dress Code and Discipline Policy)
- School Calendar and Upcoming Events (e.g. Graduation)
- After School Programs, Extracurricular Activities, and Athletics (e.g. Football)
- News and Announcements (e.g. Yearbook and Class Supply List Details)
- Graduate and Alumni Events (e.g. Organizing Class Reunions)
Navigation
Can't Find What You Are Looking For?
Rankings
Nearby Cities
Sponsored Links
K-12 Articles

Strategies to Help Kids Cope with Stress
Many parents believe that kids don't experience stress. Nothing could be further from the truth....
Many parents believe that kids don't experience stress. Nothing could be further from the truth....

Help Your Child Achieve Success in Middle School
Middle school is for children between the ages of 10 and 14 years. At this time children begin to...
Middle school is for children between the ages of 10 and 14 years. At this time children begin to...

Asperger Syndrome: A Developmental Disorder on the Autism Spectrum
Asperger Syndrome, also known as Pervasive Developmental Disorder is on the high functioning end of...
Asperger Syndrome, also known as Pervasive Developmental Disorder is on the high functioning end of...