James A. Whitaker Elementary School
Rating
Not Available
Not Available

5 out of 5 | 2 Reviews
Find Old Friends From James A. Whitaker Elementary School
Use the form below to search for alumni from James A. Whitaker Elementary School.
School Description
School Summary and Highlights
- Enrolls 668 elementary school students from grades KG-6
- Ranks 3970th out of 5,423 elementary schools in CA.
- 2010 Overall School AYP Met Status: No
Additional Contact Information
- Mailing Address: 8401 Montana Ave., Buena Park, CA 90621
School Operational Details
- Title I EligibleAll students of this school are eligible for participation in authorized programs.
School District Details
- Buena Park Elementary School District
- Per-Pupil Spending: $8,673
- Students Per Teacher: 25.1
- Enrolled Students: 5,385
Faculty Details and Student Enrollment
Students and Faculty
- Total Students Enrolled: 668
- Total Full Time "Equivalent" Teachers: 26.0
- Average Student-To-Teacher Ratio: 25.7
Students Gender Breakdown
- Males: 352 (52.7%)
- Females: 316 (47.3%)
Free Lunch Student Eligibility Breakdown
- Eligible for Reduced Lunch: 86 (12.9%)
- Eligible for Free Lunch: 491 (73.5%)
- Eligible for Either Reduced or Free Lunch: 577 (86.4%)
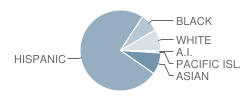
Student Enrollment Distribution by Race / Ethnicity
| Number | Percent | |
|---|---|---|
| American Indian | 5 | 0.7% |
| Black | 48 | 7.2% |
| Asian | 57 | 8.5% |
| Hispanic | 482 | 72.2% |
| White | 56 | 8.4% |
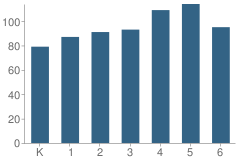
Number of Students Per Grade
| Number | Percent | |
|---|---|---|
| Kindergarten | 79 | 11.8% |
| 1st Grade | 87 | 13.0% |
| 2nd Grade | 91 | 13.6% |
| 3rd Grade | 93 | 13.9% |
| 4th Grade | 109 | 16.3% |
| 5th Grade | 114 | 17.1% |
| 6th Grade | 95 | 14.2% |
Teacher Education Background (2009)
Percent With Master's Degree
School:
21.1%
District:
13.3%
Percent With Bachelor's Degree
School:
18.4%
District:
20.0%
Teacher Credentials & Experience (2009)
Percent of Teachers With Emergency Credentials: 2.9%
Percent of Teachers With Credentials: 100.0%
Number of Certificated Staff: 38.0
Average Number of Years of Teacher Experience: 11.1
Average Age
School:
39.1
District:
43.1
Source: CA Department of Education, Source: NCES 2009-2010
School Ratings and Reviews
Overall Rating: 5

5 out of 5 | 2 Reviews
The Overall Rating is the school's average rating from parents, students, school faculty and staff. The highest rating is five apples and the lowest is one apple.
Share Your Review About This School
2 reviews for James A. Whitaker Elementary School
- Reviewed by Parent or Guardian on August 15, 2011
- Rating:
 (5 / 5) Flag as inappropriate
 - Great school, great teachers! Staff is caring and supportive of kids.
- Reviewed by Parent/Guardian on August 20, 2010
- Rating: (5 / 5) Flag as inappropriate
- love this school
School Map and Similar Schools Nearby
Click to Activate Map of Nearby School Campuses
Private
Public
This School
Similar Schools Nearby
| Mable L. Pendleton Elementary School KG-6 | 604 Students | 0.6 miles away |  5 out of 5 | |
| Glen H. Dysinger Sr. Elementary School KG-6 | 463 Students | 1.0 miles away | 5 out of 5 | |
| Carl E. Gilbert Elementary School KG-6 | 668 Students | 1.3 miles away | Not Yet Rated | |
| Charles G. Emery Elementary School KG-6 | 692 Students | 1.6 miles away | 5 out of 5 | |
| Walter Knott Elementary School KG-6 | 516 Students | 1.6 miles away | 5 out of 5 | |
| Gordon H. Beatty Elementary School KG-6 | 985 Students | 1.6 miles away | 5 out of 5 | |
| Arthur F. Corey Elementary School KG-6 | 618 Students | 2.1 miles away | 5 out of 5 | |
| Raymond Temple Elementary School KG-6 | 338 Students | 2.1 miles away | Not Yet Rated | |
| Buena Terra Elementary School KG-6 | 392 Students | 2.4 miles away | 5 out of 5 | |
| Eastwood Elementary School KG-5 | 559 Students | 2.5 miles away | Not Yet Rated | |
Compare This School To Nearby Schools ->
School Community Forum

Join a discussion about James A. Whitaker Elementary School and talk to others in the community including students, parents, teachers, and administrators.
Popular Discussion Topics
- Admissions and Registration Questions (e.g. Dress Code and Discipline Policy)
- School Calendar and Upcoming Events (e.g. Graduation)
- After School Programs, Extracurricular Activities, and Athletics (e.g. Football)
- News and Announcements (e.g. Yearbook and Class Supply List Details)
- Graduate and Alumni Events (e.g. Organizing Class Reunions)
Navigation
Can't Find What You Are Looking For?
Rankings
Nearby Cities
Sponsored Links
K-12 Articles

Feeling Good in Your Own Skin
Body image is a very touchy issue with today's kids. Since the 1950s, when Barbie was first...
Body image is a very touchy issue with today's kids. Since the 1950s, when Barbie was first...

Teaching Kids to Deal with Peer Pressure
Parents usually become very concerned when they hear the term "peer pressure." However, peer...
Parents usually become very concerned when they hear the term "peer pressure." However, peer...

What to Do when Your Student is Held Back
Kids develop at different speeds, and everyone has different skills and abilities. School is easy...
Kids develop at different speeds, and everyone has different skills and abilities. School is easy...