David Starr Jordan Middle School
Rating
Not Available
Not Available

5 out of 5 | 1 Review
Find Old Friends From David Starr Jordan Middle School
Use the form below to search for alumni from David Starr Jordan Middle School.
School Description
School Summary and Highlights
- Enrolls 1,167 middle school students from grades 6-8
- Ranks 533rd out of 2,050 middle schools in CA.
- 2010 Overall School AYP Met Status: Yes
Additional Contact Information
- Mailing Address: 420 South Mariposa St., Burbank, CA 91506
School District Details
- Burbank Unified School District
- Per-Pupil Spending: $8,623
- Graduation Rate: 86.3%
- Dropout Rate: 8.9%
- Students Per Teacher: 23.7
- Enrolled Students: 16,686
Faculty Details and Student Enrollment
Students and Faculty
- Total Students Enrolled: 1,167
- Total Full Time "Equivalent" Teachers: 48.7
- Average Student-To-Teacher Ratio: 24.0
Students Gender Breakdown
- Males: 605 (51.8%)
- Females: 562 (48.2%)
Free Lunch Student Eligibility Breakdown
- Eligible for Reduced Lunch: 124 (10.6%)
- Eligible for Free Lunch: 262 (22.5%)
- Eligible for Either Reduced or Free Lunch: 386 (33.1%)
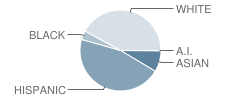
Student Enrollment Distribution by Race / Ethnicity
| Number | Percent | |
|---|---|---|
| American Indian | 2 | 0.2% |
| Black | 40 | 3.4% |
| Asian | 94 | 8.1% |
| Hispanic | 513 | 44.0% |
| White | 470 | 40.3% |
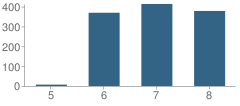
Number of Students Per Grade
| Number | Percent | |
|---|---|---|
| 5th Grade | 7 | 0.6% |
| 6th Grade | 369 | 31.6% |
| 7th Grade | 413 | 35.4% |
| 8th Grade | 378 | 32.4% |
Teacher Education Background (2009)
Percent With Ph.D.
School:
3.7%
District:
7.6%
Percent With Master's Degree
School:
22.2%
District:
30.4%
Percent With Bachelor's Degree
School:
16.7%
District:
5.1%
Teacher Credentials & Experience (2009)
Percent of Teachers With Credentials: 97.9%
Number of Certificated Staff: 54.0
Average Number of Years of Teacher Experience: 12.8
Average Age
School:
41.0
District:
47.2
Source: CA Department of Education, Source: NCES 2009-2010
School Ratings and Reviews
Overall Rating: 5

5 out of 5 | 1 Review
The Overall Rating is the school's average rating from parents, students, school faculty and staff. The highest rating is five apples and the lowest is one apple.
Share Your Review About This School
1 review for David Starr Jordan Middle School
- Reviewed by Parent/Guardian on March 22, 2010
- Rating:
 (5 / 5) Flag as inappropriate
 - I have had 2 children go to Jordan Middle scholl and I find the staff to be very rude. Since the budget cuts I am unsure that may have something to do with the disposition of the teachers, however they aren't friendly at all. I definately wouldn't call it a safe school especially being with what happen this year. I emailed the principal after the incident with the teacher that had an affair with the student and her response was " I don't know what your expectation is, but we are doing our best to ensure a safe place. I found that response to lack accountability at all when this your school.
School Map and Similar Schools Nearby
Click to Activate Map of Nearby School Campuses
Private
Public
This School
Similar Schools Nearby
| John Muir Middle School 6-8 | 1,369 Students | 1.5 miles away | Not Yet Rated | |
| Benjamin Franklin Elementary School KG-6 | 407 Students | 1.7 miles away | Not Yet Rated | |
| Luther Burbank Middle School 6-8 | 1,010 Students | 1.7 miles away |  5 out of 5 | |
| Thomas Jefferson Elementary School KG-6 | 538 Students | 2.1 miles away | Not Yet Rated | |
| Balboa Elementary School KG-6 | 556 Students | 2.1 miles away |  4.5 out of 5 | |
| East Valley Area New High School #1b 8-12 | 1,219 Students | 2.8 miles away | Not Yet Rated | |
| Eleanor J. Toll Middle School 6-8 | 1,268 Students | 3.0 miles away | Not Yet Rated | |
| Sun Valley Middle School 6-8 | 1,457 Students | 3.8 miles away | Not Yet Rated | |
| Walter Reed Middle School 6-8 | 1,601 Students | 4.0 miles away | 5 out of 5 | |
| Thomas Edison Elementary School KG-6 | 718 Students | 4.1 miles away | Not Yet Rated | |
Compare This School To Nearby Schools ->
School Community Forum

Join a discussion about David Starr Jordan Middle School and talk to others in the community including students, parents, teachers, and administrators.
Popular Discussion Topics
- Admissions and Registration Questions (e.g. Dress Code and Discipline Policy)
- School Calendar and Upcoming Events (e.g. Graduation)
- After School Programs, Extracurricular Activities, and Athletics (e.g. Football)
- News and Announcements (e.g. Yearbook and Class Supply List Details)
- Graduate and Alumni Events (e.g. Organizing Class Reunions)
Navigation
Can't Find What You Are Looking For?
Rankings
Nearby Cities
Sponsored Links
K-12 Articles

Who is Safe?
Between September 26 and October 2, 2006, there were three deadly school shootings and...
Between September 26 and October 2, 2006, there were three deadly school shootings and...

When Bad Report Cards Happen to Good Kids
It's mid-term season once again, and semester (or quarter or trimester) grades will be coming out...
It's mid-term season once again, and semester (or quarter or trimester) grades will be coming out...

Your Child and School Corporal Punishment
Your child comes home at the end of the school day with a huge bruise on his upper arm. When you...
Your child comes home at the end of the school day with a huge bruise on his upper arm. When you...