San Andreas Elementary School
Rating
Not Available
Not Available

No Reviews Yet
Find Old Friends From San Andreas Elementary School
Use the form below to search for alumni from San Andreas Elementary School.
School Description
School Summary and Highlights
- Enrolls 327 elementary school students from grades KG-6
- Ranks 3152nd out of 5,423 elementary schools in CA.
- 2010 Overall School AYP Met Status: No
Additional Contact Information
- Mailing Address: PO Box 67, San Andreas, CA 95249
School Operational Details
- Title I EligibleAll students of this school are eligible for participation in authorized programs.
School District Details
- Calaveras Unified School District
- Per-Pupil Spending: $8,818
- Graduation Rate: 82.0%
- Dropout Rate: 2.0%
- Students Per Teacher: 21.1
- Enrolled Students: 3,479
Faculty Details and Student Enrollment
Students and Faculty
- Total Students Enrolled: 327
- Total Full Time "Equivalent" Teachers: 15.0
- Average Student-To-Teacher Ratio: 21.8
Students Gender Breakdown
- Males: 189 (57.8%)
- Females: 138 (42.2%)
Free Lunch Student Eligibility Breakdown
- Eligible for Reduced Lunch: 35 (10.7%)
- Eligible for Free Lunch: 169 (51.7%)
- Eligible for Either Reduced or Free Lunch: 204 (62.4%)
Student Enrollment Distribution by Race / Ethnicity
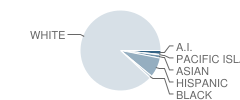
| Number | Percent | |
|---|---|---|
| American Indian | 5 | 1.5% |
| Black | 3 | 0.9% |
| Asian | 4 | 1.2% |
| Hispanic | 24 | 7.3% |
| White | 264 | 80.7% |
Number of Students Per Grade
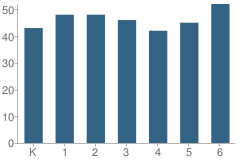
| Number | Percent | |
|---|---|---|
| Kindergarten | 43 | 13.1% |
| 1st Grade | 48 | 14.7% |
| 2nd Grade | 48 | 14.7% |
| 3rd Grade | 46 | 14.1% |
| 4th Grade | 42 | 12.8% |
| 5th Grade | 45 | 13.8% |
| 6th Grade | 52 | 15.9% |
| Ungraded | 3 | 0.9% |
Teacher Education Background (2009)
Percent With Bachelor's Degree: 5.6%
Teacher Credentials & Experience (2009)
Percent of Teachers With Emergency Credentials: 5.9%
Percent of Teachers With Credentials: 88.2%
Number of Certificated Staff: 18.0
Average Number of Years of Teacher Experience: 11.4
Average Age
School:
48.0
District:
49.7
Source: CA Department of Education, Source: NCES 2009-2010
School Ratings and Reviews
Be The First To Review San Andreas Elementary School!
School Map and Similar Schools Nearby
Click to Activate Map of Nearby School Campuses
Private
Public
This School
Similar Schools Nearby
| Mokelumne Hill Elementary School KG-6 | 94 Students | 7.3 miles away |  5 out of 5 | |
| Valley Springs Elementary School KG-6 | 525 Students | 8.6 miles away | 5 out of 5 | |
| Mark Twain Elementary School KG-8 | 479 Students | 10.6 miles away | Not Yet Rated | |
| Jenny Lind Elementary School KG-6 | 621 Students | 11.1 miles away | Not Yet Rated | |
| Jackson Elementary School KG-6 | 431 Students | 12.1 miles away | Not Yet Rated | |
| Albert A. Michelson Elementary School KG-5 | 256 Students | 12.6 miles away | Not Yet Rated | |
| Rail Road Flat Elementary School KG-6 | 83 Students | 13.0 miles away | Not Yet Rated | |
| Pine Grove Elementary School KG-6 | 268 Students | 14.1 miles away | Not Yet Rated | |
| Copperopolis Elementary School KG-6 | 273 Students | 14.9 miles away | 5 out of 5 | |
| Sutter Creek Elementary School KG-6 | 354 Students | 15.9 miles away | 5 out of 5 | |
Compare This School To Nearby Schools ->
School Community Forum

Join a discussion about San Andreas Elementary School and talk to others in the community including students, parents, teachers, and administrators.
Popular Discussion Topics
- Admissions and Registration Questions (e.g. Dress Code and Discipline Policy)
- School Calendar and Upcoming Events (e.g. Graduation)
- After School Programs, Extracurricular Activities, and Athletics (e.g. Football)
- News and Announcements (e.g. Yearbook and Class Supply List Details)
- Graduate and Alumni Events (e.g. Organizing Class Reunions)
Navigation
Can't Find What You Are Looking For?
Rankings
Nearby Cities
Sponsored Links
K-12 Articles

Cut the Credit and Save You Some Money
Today’s society glorifies a get-it-now mentality. Children learn this early. You probably noticed...
Today’s society glorifies a get-it-now mentality. Children learn this early. You probably noticed...

School Violence: Can It Be Stopped
It’s a fact that violence in schools is prevalent in today’s society. We hear of school shootings,...
It’s a fact that violence in schools is prevalent in today’s society. We hear of school shootings,...

Who is Safe?
Between September 26 and October 2, 2006, there were three deadly school shootings and...
Between September 26 and October 2, 2006, there were three deadly school shootings and...