Westmont High School
Rating
Not Available
Not Available

No Reviews Yet
Find Old Friends From Westmont High School
Use the form below to search for alumni from Westmont High School.
School Description
School Summary and Highlights
- Enrolls 1,688 high school students from grades 9-12
- Ranks 381st out of 1,197 high schools in CA.
- 2010 Overall School AYP Met Status: No
Additional Contact Information
- Mailing Address: 4805 Westmont Ave., Campbell, CA 95008
School District Details
- Campbell Union High School District
- Per-Pupil Spending: $8,744
- Dropout Rate: 5.9%
- Students Per Teacher: 22.0
- Enrolled Students: 7,764
Faculty Details and Student Enrollment
Students and Faculty
- Total Students Enrolled: 1,688
- Total Full Time "Equivalent" Teachers: 72.2
- Average Student-To-Teacher Ratio: 23.4
Students Gender Breakdown
- Males: 883 (52.3%)
- Females: 805 (47.7%)
Free Lunch Student Eligibility Breakdown
- Eligible for Reduced Lunch: 39 (2.3%)
- Eligible for Free Lunch: 287 (17.0%)
- Eligible for Either Reduced or Free Lunch: 326 (19.3%)
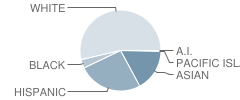
Student Enrollment Distribution by Race / Ethnicity
| Number | Percent | |
|---|---|---|
| American Indian | 5 | 0.3% |
| Black | 56 | 3.3% |
| Asian | 266 | 15.8% |
| Hispanic | 409 | 24.2% |
| White | 850 | 50.4% |
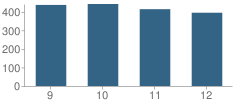
Number of Students Per Grade
| Number | Percent | |
|---|---|---|
| 9th Grade | 437 | 25.9% |
| 10th Grade | 442 | 26.2% |
| 11th Grade | 414 | 24.5% |
| 12th Grade | 395 | 23.4% |
Graduates Information (2010)
Graduation Rate
School:
84.3%
District:
81.5%
State:
78.6%
Teacher Education Background (2009)
Percent With Master's Degree
School:
14.1%
District:
11.1%
Percent With Bachelor's Degree
School:
6.4%
District:
16.7%
Teacher Credentials & Experience (2009)
Percent of Teachers With Emergency Credentials: 7.1%
Percent of Teachers With Credentials: 97.1%
Number of Certificated Staff: 78.0
Average Number of Years of Teacher Experience: 11.7
Average Age
School:
42.8
District:
44.0
Source: CA Department of Education, Source: NCES 2009-2010
School Ratings and Reviews
Be The First To Review Westmont High School!
School Map and Similar Schools Nearby
Click to Activate Map of Nearby School Campuses
Private
Public
This School
Similar Schools Nearby
| Prospect High School 9-12 | 1,412 Students | 1.8 miles away | Not Yet Rated | |
| Saratoga High School 9-12 | 1,368 Students | 2.4 miles away | Not Yet Rated | |
| Lynbrook High School 9-12 | 1,837 Students | 2.4 miles away | Not Yet Rated | |
| Los Gatos High School 9-12 | 1,794 Students | 3.4 miles away | Not Yet Rated | |
| Cupertino High School 9-12 | 1,708 Students | 3.7 miles away | Not Yet Rated | |
| Del Mar High School 9-12 | 1,282 Students | 3.8 miles away |  4 out of 5 | |
| Leigh High School 9-12 | 1,713 Students | 3.9 miles away |  5 out of 5 | |
| Middle College High School 10-12 | 40 Students | 4.4 miles away | Not Yet Rated | |
| Branham High School 9-12 | 1,386 Students | 4.9 miles away | Not Yet Rated | |
| Monta Vista High School 9-12 | 2,529 Students | 5.0 miles away | Not Yet Rated | |
Compare This School To Nearby Schools ->
School Community Forum

Join a discussion about Westmont High School and talk to others in the community including students, parents, teachers, and administrators.
Popular Discussion Topics
- Admissions and Registration Questions (e.g. Dress Code and Discipline Policy)
- School Calendar and Upcoming Events (e.g. Graduation)
- After School Programs, Extracurricular Activities, and Athletics (e.g. Football)
- News and Announcements (e.g. Yearbook and Class Supply List Details)
- Graduate and Alumni Events (e.g. Organizing Class Reunions)
Navigation
Can't Find What You Are Looking For?
Rankings
Nearby Cities
Sponsored Links
K-12 Articles

Preparing Your Child for the First Day of School
It seems like school was just dismissed for the summer, yet here we are facing another year of back...
It seems like school was just dismissed for the summer, yet here we are facing another year of back...

Special Needs Education: Your Child, Your Rights
Many children today have special needs that make it difficult for them to learn. It's imperative...
Many children today have special needs that make it difficult for them to learn. It's imperative...

Kids and Competition
In the backyard, the classroom, the community and while participating in sports and other...
In the backyard, the classroom, the community and while participating in sports and other...