Castro Valley High School
19400 Santa Maria Ave, Castro Valley, CA 94546 | (510) 537-5910
- Grades: 9-12
- Student Enrollment: 2,897

No Reviews Yet
Find Old Friends From Castro Valley High School
Use the form below to search for alumni from Castro Valley High School.
School Description
School Summary and Highlights
- Enrolls 2,897 high school students from grades 9-12
- Ranks 277th out of 1,197 high schools in CA.
- 2010 Overall School AYP Met Status: Yes
Additional Contact Information
- Mailing Address: PO Box 2146, Castro Valley, CA 94546
School District Details
- Castro Valley Unified School District
- Per-Pupil Spending: $8,622
- Graduation Rate: 87.4%
- Dropout Rate: 1.5%
- Students Per Teacher: 21.8
- Enrolled Students: 8,894
Faculty Details and Student Enrollment
Students and Faculty
- Total Students Enrolled: 2,897
- Total Full Time "Equivalent" Teachers: 114.0
- Average Student-To-Teacher Ratio: 25.4
Students Gender Breakdown
- Males: 1,469 (50.7%)
- Females: 1,428 (49.3%)
Free Lunch Student Eligibility Breakdown
- Eligible for Reduced Lunch: 150 (5.2%)
- Eligible for Free Lunch: 312 (10.8%)
- Eligible for Either Reduced or Free Lunch: 462 (15.9%)
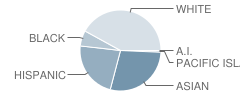
Student Enrollment Distribution by Race / Ethnicity

| Number | Percent | |
|---|---|---|
| American Indian | 5 | 0.2% |
| Black | 161 | 5.6% |
| Asian | 735 | 25.4% |
| Hispanic | 588 | 20.3% |
| White | 1,087 | 37.5% |
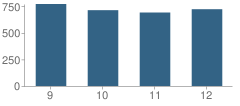
Number of Students Per Grade

| Number | Percent | |
|---|---|---|
| 9th Grade | 771 | 26.6% |
| 10th Grade | 713 | 24.6% |
| 11th Grade | 691 | 23.9% |
| 12th Grade | 722 | 24.9% |
Graduates Information (2010)
Graduation Rate
School:
95.3%
District:
92.4%
State:
78.6%
Teacher Education Background (2009)
Percent With Ph.D.
School:
4.1%
District:
12.5%
Percent With Master's Degree
School:
20.7%
District:
34.4%
Percent With Bachelor's Degree: 10.3%
Teacher Credentials & Experience (2009)
Percent of Teachers With Credentials: 96.8%
Number of Certificated Staff: 145.0
Average Number of Years of Teacher Experience: 11.3
Average Age
School:
40.5
District:
51.7
Source: CA Department of Education, Source: NCES 2009-2010
School Ratings and Reviews
Be The First To Review Castro Valley High School!
Sponsored Links
Test Scores and Performance Information
Overall School Rating
How is this determined?
The overall school rating shows that Castro Valley High School performed on average better than many other schools across the state on CST state exams in the following subjects:
- CST Algebra I
- CST Algebra II
- CST Biology
- CST Chemistry
- CST English-Language Arts
- CST Geometry
- CST Physics
- CST Science
- CST Summative High School Math
- CST U.S. History
- CST World History
AYP Results (2010)
Overall AYP Met: Yes
ELA AYP Met: Yes
Math AYP Met: Yes
ACT Exam Results (2009)
Percent of Students Taking ACT Exam: 20.1%
Average Combined Score: 23.7
Percent Scoring At or Above 21: 74.6%
SAT Exam Results (2009)
Percent of Students Taking SAT Exam: 57.9%
Average Combined Score: 1,587.4
Critical Reading Average: 516.5
Math Average: 551.4
Writing Average: 519.5
Percent Scoring At or Above 1500: 63.1%
CST - Test Proficiency by Grade and Subject
Grade 9 - % of students at or above proficiency
| School | District | State | |
|---|---|---|---|
| CST Algebra I Test | |||
| 2010 | 19.0% | 19.0% | 22.0% |
| 2009 | 21.0% | 20.0% | 21.0% |
| 2008 | 26.0% | 26.0% | 18.0% |
| CST Algebra II Test | |||
| 2010 | 81.0% | 81.0% | 69.0% |
| 2009 | 69.0% | 69.0% | 65.0% |
| 2008 | 80.0% | 80.0% | 66.0% |
| CST Biology Test | |||
| 2010 | 70.0% | 70.0% | 55.0% |
| 2009 | 74.0% | 74.0% | 51.0% |
| 2008 | 85.0% | 85.0% | 52.0% |
| CST English-Language Arts Test | |||
| 2010 | 72.0% | 72.0% | 54.0% |
| 2009 | 69.0% | 67.0% | 50.0% |
| 2008 | 69.0% | 68.0% | 49.0% |
| CST Geometry Test | |||
| 2010 | 64.0% | 64.0% | 46.0% |
| 2009 | 61.0% | 61.0% | 47.0% |
| 2008 | 67.0% | 67.0% | 43.0% |
Grade 10 - % of students at or above proficiency
| School | District | State | |
|---|---|---|---|
| CST Algebra I Test | |||
| 2010 | 4.0% | 9.0% | 12.0% |
| 2009 | 7.0% | 6.0% | 11.0% |
| 2008 | 9.0% | 9.0% | 9.0% |
| CST Algebra II Test | |||
| 2010 | 35.0% | 35.0% | 40.0% |
| 2009 | 31.0% | 31.0% | 37.0% |
| 2008 | 50.0% | 50.0% | 36.0% |
| CST Biology Test | |||
| 2010 | 46.0% | 45.0% | 38.0% |
| 2009 | 42.0% | 42.0% | 34.0% |
| 2008 | 53.0% | 52.0% | 35.0% |
| CST Chemistry Test | |||
| 2010 | 60.0% | 60.0% | 47.0% |
| 2009 | 63.0% | 63.0% | 44.0% |
| 2008 | 60.0% | 60.0% | 41.0% |
| CST English-Language Arts Test | |||
| 2010 | 59.0% | 56.0% | 45.0% |
| 2009 | 62.0% | 60.0% | 44.0% |
| 2008 | 61.0% | 59.0% | 41.0% |
| CST Geometry Test | |||
| 2010 | 18.0% | 18.0% | 14.0% |
| 2009 | 24.0% | 24.0% | 14.0% |
| 2008 | 31.0% | 30.0% | 12.0% |
| CST Science Test | |||
| 2010 | 67.0% | 65.0% | 46.0% |
| 2009 | 67.0% | 63.0% | 44.0% |
| 2008 | 61.0% | 61.0% | 40.0% |
| CST Summative High School Math Test | |||
| 2010 | 86.0% | 86.0% | 75.0% |
| 2009 | 90.0% | 90.0% | 71.0% |
| 2008 | 93.0% | 93.0% | 68.0% |
| CST World History Test | |||
| 2010 | 61.0% | 58.0% | 42.0% |
| 2009 | 58.0% | 56.0% | 38.0% |
| 2008 | 56.0% | 53.0% | 33.0% |
Grade 11 - % of students at or above proficiency
| School | District | State | |
|---|---|---|---|
| CST Algebra I Test | |||
| 2010 | 11.0% | 10.0% | 8.0% |
| 2009 | - | - | - |
| 2008 | 3.0% | 2.0% | 5.0% |
| CST Algebra II Test | |||
| 2010 | 14.0% | 14.0% | 14.0% |
| 2009 | 13.0% | 12.0% | 12.0% |
| 2008 | 13.0% | 13.0% | 11.0% |
| CST Biology Test | |||
| 2010 | 26.0% | 20.0% | 46.0% |
| 2009 | 33.0% | 29.0% | 41.0% |
| 2008 | 33.0% | 27.0% | 39.0% |
| CST Chemistry Test | |||
| 2010 | 40.0% | 40.0% | 30.0% |
| 2009 | 35.0% | 35.0% | 27.0% |
| 2008 | 33.0% | 33.0% | 25.0% |
| CST English-Language Arts Test | |||
| 2010 | 55.0% | 51.0% | 42.0% |
| 2009 | 56.0% | 52.0% | 40.0% |
| 2008 | 51.0% | 47.0% | 37.0% |
| CST Geometry Test | |||
| 2010 | 13.0% | 13.0% | 6.0% |
| 2009 | 17.0% | 16.0% | 7.0% |
| 2008 | 23.0% | 23.0% | 6.0% |
| CST Physics Test | |||
| 2010 | 81.0% | 81.0% | 53.0% |
| 2009 | 77.0% | 77.0% | 50.0% |
| 2008 | 85.0% | 84.0% | 47.0% |
| CST Summative High School Math Test | |||
| 2010 | 60.0% | 60.0% | 50.0% |
| 2009 | 66.0% | 66.0% | 47.0% |
| 2008 | 56.0% | 56.0% | 43.0% |
| CST U.S. History Test | |||
| 2010 | 62.0% | 57.0% | 45.0% |
| 2009 | 57.0% | 53.0% | 44.0% |
| 2008 | 50.0% | 47.0% | 38.0% |
End of Course - % of students at or above proficiency
| School | District | State | |
|---|---|---|---|
| CST Algebra I Test | |||
| 2010 | 17.0% | 44.0% | 31.0% |
| 2009 | 17.0% | 42.0% | 28.0% |
| 2008 | 18.0% | 38.0% | 25.0% |
| CST Algebra II Test | |||
| 2010 | 36.0% | 36.0% | 31.0% |
| 2009 | 33.0% | 33.0% | 28.0% |
| 2008 | 42.0% | 41.0% | 27.0% |
| CST Biology Test | |||
| 2010 | 62.0% | 60.0% | 46.0% |
| 2009 | 60.0% | 60.0% | 42.0% |
| 2008 | 66.0% | 64.0% | 42.0% |
| CST Chemistry Test | |||
| 2010 | 53.0% | 53.0% | 38.0% |
| 2009 | 49.0% | 49.0% | 36.0% |
| 2008 | 44.0% | 44.0% | 32.0% |
| CST Geometry Test | |||
| 2010 | 38.0% | 50.0% | 27.0% |
| 2009 | 35.0% | 45.0% | 26.0% |
| 2008 | 44.0% | 51.0% | 24.0% |
| CST Physics Test | |||
| 2010 | 81.0% | 81.0% | 49.0% |
| 2009 | 77.0% | 77.0% | 46.0% |
| 2008 | 85.0% | 84.0% | 43.0% |
| CST Summative High School Math Test | |||
| 2010 | 68.0% | 68.0% | 54.0% |
| 2009 | 71.0% | 71.0% | 50.0% |
| 2008 | 64.0% | 64.0% | 47.0% |
| CST World History Test | |||
| 2010 | 61.0% | 58.0% | 41.0% |
| 2009 | 57.0% | 55.0% | 38.0% |
| 2008 | 54.0% | 51.0% | 33.0% |
Source: CA Department of Education 2009-2010
School Map and Similar Schools Nearby
Click to Activate Map of Nearby School Campuses
Private
Public
This School
Similar Schools Nearby
| Hayward High School 9-12 | 1,694 Students | 2.4 miles away | ![]() 3.5 out of 5 | |
| San Lorenzo High School 9-12 | 1,451 Students | 2.8 miles away | ![]() 2 out of 5 | |
| San Leandro High School 9-12 | 2,685 Students | 3.6 miles away | ![]() 4.5 out of 5 | |
| Arroyo High School 9-12 | 1,871 Students | 3.8 miles away | Not Yet Rated | |
| Tennyson High School 9-12 | 1,447 Students | 4.4 miles away | ![]() 4 out of 5 | |
| Mt. Eden High School 9-12 | 2,003 Students | 5.6 miles away | ![]() 3 out of 5 | |
| Leadership Preparatory High School 9-12 | 373 Students | 6.0 miles away | Not Yet Rated | |
| Yes, Youth Empowerment School 9-12 | 225 Students | 6.0 miles away | Not Yet Rated | |
| Coliseum College Preparatory Academy 6-12 | 312 Students | 7.5 miles away | Not Yet Rated | - |
| California High School 9-12 | 2,431 Students | 7.8 miles away | Not Yet Rated | |
Compare This School To Nearby Schools ->
School Community Forum

Join a discussion about Castro Valley High School and talk to others in the community including students, parents, teachers, and administrators.
Popular Discussion Topics
- Admissions and Registration Questions (e.g. Dress Code and Discipline Policy)
- School Calendar and Upcoming Events (e.g. Graduation)
- After School Programs, Extracurricular Activities, and Athletics (e.g. Football)
- News and Announcements (e.g. Yearbook and Class Supply List Details)
- Graduate and Alumni Events (e.g. Organizing Class Reunions)
Navigation
Can't Find What You Are Looking For?
Rankings
Nearby Cities
Sponsored Links
K-12 Articles
Teaching Children a Love of History
Parents and grandparents are responsible for teaching children a love of history. To begin, relate...
Middle School Homework and Study Habits
The report cards came home and you're disappointed with your child's scores. You know he has the...
The Difference Between Boys and Girls
Boys and girls are different. Give a toddler girl a G.I. Joe and she'll probably try to mother it....


