Creekside Middle School
Rating
Not Available
Not Available

No Reviews Yet
Find Old Friends From Creekside Middle School
Use the form below to search for alumni from Creekside Middle School.
School Description
School Summary and Highlights
- Enrolls 788 middle school students from grades 6-8
- Ranks 315th out of 2,050 middle schools in CA.
- 2010 Overall School AYP Met Status: Yes
Additional Contact Information
- Mailing Address: PO Box 2146, Castro Valley, CA 94546
School District Details
- Castro Valley Unified School District
- Per-Pupil Spending: $8,622
- Graduation Rate: 87.4%
- Dropout Rate: 1.5%
- Students Per Teacher: 21.8
- Enrolled Students: 8,894
Faculty Details and Student Enrollment
Students and Faculty
- Total Students Enrolled: 788
- Total Full Time "Equivalent" Teachers: 31.1
- Average Student-To-Teacher Ratio: 25.3
Students Gender Breakdown
- Males: 404 (51.3%)
- Females: 384 (48.7%)
Free Lunch Student Eligibility Breakdown
- Eligible for Reduced Lunch: 41 (5.2%)
- Eligible for Free Lunch: 85 (10.8%)
- Eligible for Either Reduced or Free Lunch: 126 (16.0%)
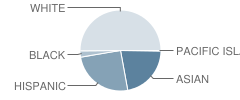
Student Enrollment Distribution by Race / Ethnicity
| Number | Percent | |
|---|---|---|
| American Indian | - | - |
| Black | 18 | 2.3% |
| Asian | 156 | 19.8% |
| Hispanic | 180 | 22.8% |
| White | 358 | 45.4% |
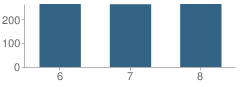
Number of Students Per Grade
| Number | Percent | |
|---|---|---|
| 6th Grade | 263 | 33.4% |
| 7th Grade | 262 | 33.2% |
| 8th Grade | 263 | 33.4% |
Teacher Education Background (2009)
Percent With Master's Degree
School:
26.3%
District:
34.4%
Percent With Bachelor's Degree: 7.9%
Teacher Credentials & Experience (2009)
Percent of Teachers With Credentials: 100.0%
Number of Certificated Staff: 38.0
Average Number of Years of Teacher Experience: 14.5
Average Age
School:
43.1
District:
51.7
Source: CA Department of Education, Source: NCES 2009-2010
School Ratings and Reviews
Be The First To Review Creekside Middle School!
School Map and Similar Schools Nearby
Click to Activate Map of Nearby School Campuses
Private
Public
This School
Similar Schools Nearby
| Canyon Middle School 6-8 | 1,342 Students | 0.6 miles away |  5 out of 5 | |
| Fairview Elementary School KG-6 | 472 Students | 1.4 miles away | Not Yet Rated | |
| Strobridge Elementary School KG-6 | 566 Students | 1.7 miles away | Not Yet Rated | |
| Hayward Project School KG-8 | 142 Students | 1.8 miles away | Not Yet Rated | |
| East Avenue Elementary School KG-6 | 614 Students | 2.0 miles away |  3 out of 5 | |
| Cherryland Elementary School KG-6 | 785 Students | 2.6 miles away |  3.5 out of 5 | |
| Burbank Elementary School KG-6 | 797 Students | 2.9 miles away |  1 out of 5 | |
| Edendale Middle School 6-8 | 624 Students | 3.1 miles away | Not Yet Rated | |
| Harder Elementary School KG-6 | 668 Students | 3.4 miles away |  2 out of 5 | |
| Stonebrae Elementary School KG-6 | 726 Students | 3.8 miles away | Not Yet Rated | |
Compare This School To Nearby Schools ->
School Community Forum

Join a discussion about Creekside Middle School and talk to others in the community including students, parents, teachers, and administrators.
Popular Discussion Topics
- Admissions and Registration Questions (e.g. Dress Code and Discipline Policy)
- School Calendar and Upcoming Events (e.g. Graduation)
- After School Programs, Extracurricular Activities, and Athletics (e.g. Football)
- News and Announcements (e.g. Yearbook and Class Supply List Details)
- Graduate and Alumni Events (e.g. Organizing Class Reunions)
Navigation
Can't Find What You Are Looking For?
Rankings
Nearby Cities
Sponsored Links
K-12 Articles

Summer Safety Tips to Keep Kids Safe
It won't be long until kids run from the school, shrieking in delight because they're free for the...
It won't be long until kids run from the school, shrieking in delight because they're free for the...

Bullycide: What is It and How Can It Be Prevented?
Disclaimer: This article expresses my opinion that has been formed by personal experience and...
Disclaimer: This article expresses my opinion that has been formed by personal experience and...

Promoting Childhood Literacy
The number of American adults who are illiterate is astounding. People who lack the ability to read...
The number of American adults who are illiterate is astounding. People who lack the ability to read...