Millvale Elementary School
Rating
Not Available
Not Available

No Reviews Yet
Find Old Friends From Millvale Elementary School
Use the form below to search for alumni from Millvale Elementary School.
School Description
School Summary and Highlights
- Enrolls 410 preschool and elementary school students from grades PK-8
- Ranks 908th out of 1,038 middle schools in OH.
Additional Contact Information
- Mailing Address: 1930 Fricke Road, Cincinnati, OH 45225
- Principal or Admin: Sean A. Mccauley
- Fax: (513) 363-3620
School Operational Details
- Title I EligibleAll students of this school are eligible for participation in authorized programs.
School District Details
- Cincinnati City School District
- Per-Pupil Spending: $13,216
- Graduation Rate: 54.3%
- Dropout Rate: 3.9%
- Students Per Teacher: 18.7
- Enrolled Students: 33,549
Faculty Details and Student Enrollment
Students and Faculty
- Total Students Enrolled: 410
- Total Full Time "Equivalent" Teachers: 23.5
- Average Student-To-Teacher Ratio: 17.5
Students Gender Breakdown
- Males: 210 (51.2%)
- Females: 189 (46.1%)
Free Lunch Student Eligibility Breakdown
- Eligible for Reduced Lunch: 6 (1.5%)
- Eligible for Free Lunch: 401 (97.8%)
- Eligible for Either Reduced or Free Lunch: 407 (99.3%)
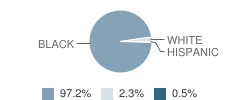
Student Enrollment Distribution by Race / Ethnicity
| Number | Percent | |
|---|---|---|
| American Indian | - | - |
| Black | 388 | 94.6% |
| Asian | - | - |
| Hispanic | 2 | 0.5% |
| White | 9 | 2.2% |
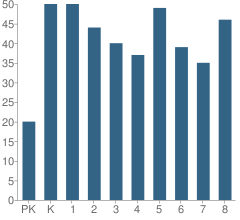
Number of Students Per Grade
| Number | Percent | |
|---|---|---|
| Pre-Kindergarten | 20 | 4.9% |
| Kindergarten | 50 | 12.2% |
| 1st Grade | 50 | 12.2% |
| 2nd Grade | 44 | 10.7% |
| 3rd Grade | 40 | 9.8% |
| 4th Grade | 37 | 9.0% |
| 5th Grade | 49 | 12.0% |
| 6th Grade | 39 | 9.5% |
| 7th Grade | 35 | 8.5% |
| 8th Grade | 46 | 11.2% |
Teacher Credentials & Experience (2010)
Percent of Teachers That Have at Least a Master's Degree
School:
43.6%
District:
67.6%
Percent of Teachers That Have at Least a Bachelor's Degree
School:
100.0%
District:
99.7%
Percent of Teachers That Are Properly Certified
School:
100.0%
District:
91.7%
Percent of Teachers That Are Not Highly Qualified
School:
0.8%
District:
7.8%
Average Years of Teacher Experience
School:
16.0
District:
17.0
Average Teacher Salary
School:
$61,743
District:
$64,344
Source: OH Department of Education, Source: NCES 2009-2010
School Ratings and Reviews
Be The First To Review Millvale Elementary School!
School Map and Similar Schools Nearby
Click to Activate Map of Nearby School Campuses
Private
Public
This School
Similar Schools Nearby
| Roll Hill School PK-8 | 584 Students | 0.7 miles away |  5 out of 5 | |
| Chase Elementary School PK-8 | 329 Students | 1.5 miles away | Not Yet Rated | |
| Westwood Elementary School PK-8 | 367 Students | 1.8 miles away | 5 out of 5 | |
| Fairview Elementary School PK-6 | 689 Students | 1.9 miles away | Not Yet Rated | |
| Roberts Paideia Academy PK-8 | 712 Students | 2.1 miles away | Not Yet Rated | |
| Dater Montessori Elementary School PK-6 | 723 Students | 2.1 miles away | Not Yet Rated | |
| Quebec Heights Elementary School PK-8 | 341 Students | 2.1 miles away |  4 out of 5 | |
| Rees E. Price Elementary School PK-10 | 648 Students | 2.3 miles away | Not Yet Rated | |
| Schiel Prim School Arts Enrichment Elementary School KG-4 | 457 Students | 2.5 miles away | Not Yet Rated | |
| Rothenberg Preparatory Academy PK-8 | 328 Students | 2.7 miles away |  3.5 out of 5 | |
Compare This School To Nearby Schools ->
School Community Forum

Join a discussion about Millvale Elementary School and talk to others in the community including students, parents, teachers, and administrators.
Popular Discussion Topics
- Admissions and Registration Questions (e.g. Dress Code and Discipline Policy)
- School Calendar and Upcoming Events (e.g. Graduation)
- After School Programs, Extracurricular Activities, and Athletics (e.g. Football)
- News and Announcements (e.g. Yearbook and Class Supply List Details)
- Graduate and Alumni Events (e.g. Organizing Class Reunions)
Navigation
Can't Find What You Are Looking For?
Sponsored Links
K-12 Articles

All About Backpacks
Your child riffles through his backpack to find homework assignments, his MP3 player, lunch money...
Your child riffles through his backpack to find homework assignments, his MP3 player, lunch money...

Information on Cyberbullying
What is Cyberbullying? Cyberbullying is a new form of harassment, emotional abuse,...
What is Cyberbullying? Cyberbullying is a new form of harassment, emotional abuse,...

School's out for Recess
Recess used to be the best part of school; that and lunch. But today, a shocking two-thirds of...
Recess used to be the best part of school; that and lunch. But today, a shocking two-thirds of...