Oyler Elementary School
Rating
Not Available
Not Available

5 out of 5 | 4 Reviews
Find Old Friends From Oyler Elementary School
Use the form below to search for alumni from Oyler Elementary School.
School Description
School Summary and Highlights
- Enrolls 753 school students from grades PK-12
- Ranks 756th out of 812 high schools in OH.
Additional Contact Information
- Principal or Admin: Craig D. Hockenberry
- Fax: (513) 363-4120
School Operational Details
- Title I EligibleAll students of this school are eligible for participation in authorized programs.
School District Details
- Cincinnati City School District
- Per-Pupil Spending: $13,216
- Graduation Rate: 54.3%
- Dropout Rate: 3.9%
- Students Per Teacher: 18.7
- Enrolled Students: 33,549
Faculty Details and Student Enrollment
Students and Faculty
- Total Students Enrolled: 753
- Total Full Time "Equivalent" Teachers: 38.0
- Average Student-To-Teacher Ratio: 19.8
Students Gender Breakdown
- Males: 351 (46.6%)
- Females: 376 (49.9%)
Free Lunch Student Eligibility Breakdown
- Eligible for Reduced Lunch: 22 (2.9%)
- Eligible for Free Lunch: 665 (88.3%)
- Eligible for Either Reduced or Free Lunch: 687 (91.2%)
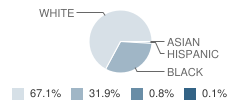
Student Enrollment Distribution by Race / Ethnicity
| Number | Percent | |
|---|---|---|
| American Indian | - | - |
| Black | 232 | 30.8% |
| Asian | 1 | 0.1% |
| Hispanic | 6 | 0.8% |
| White | 488 | 64.8% |
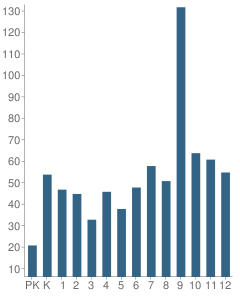
Number of Students Per Grade
| Number | Percent | |
|---|---|---|
| Pre-Kindergarten | 21 | 2.8% |
| Kindergarten | 54 | 7.2% |
| 1st Grade | 47 | 6.2% |
| 2nd Grade | 45 | 6.0% |
| 3rd Grade | 33 | 4.4% |
| 4th Grade | 46 | 6.1% |
| 5th Grade | 38 | 5.0% |
| 6th Grade | 48 | 6.4% |
| 7th Grade | 58 | 7.7% |
| 8th Grade | 51 | 6.8% |
| 9th Grade | 132 | 17.5% |
| 10th Grade | 64 | 8.5% |
| 11th Grade | 61 | 8.1% |
| 12th Grade | 55 | 7.3% |
Graduate Information (2009)
Graduation Rate
School:
50.0%
District:
80.4%
Graduating With Honors
School:
13.3%
District:
20.1%
Graduates Taking ACT
School:
60.0%
District:
68.4%
Teacher Credentials & Experience (2010)
Percent of Teachers That Have at Least a Master's Degree
School:
65.9%
District:
67.6%
Percent of Teachers That Have at Least a Bachelor's Degree
School:
100.0%
District:
99.7%
Percent of Teachers That Are Properly Certified
School:
93.0%
District:
91.7%
Percent of Teachers That Are Not Highly Qualified
School:
3.2%
District:
7.8%
Average Years of Teacher Experience
School:
17.0
District:
17.0
Average Teacher Salary
School:
$64,306
District:
$64,344
Source: OH Department of Education, Source: NCES 2009-2010
School Ratings and Reviews
Overall Rating: 5

5 out of 5 | 4 Reviews
The Overall Rating is the school's average rating from parents, students, school faculty and staff. The highest rating is five apples and the lowest is one apple.
Share Your Review About This School
4 reviews for Oyler Elementary School
- Reviewed by Parent or Guardian on November 25, 2010
- Rating:
 (5 / 5) Flag as inappropriate
 - I went to the school back in the 70 and it was great , Jerry oaks was so nice to th kids and so was the other staff...
- Reviewed by Parent/Guardian on May 05, 2010
- Rating: (5 / 5) Flag as inappropriate
- if you want you kids to be bullied or blamed for anything even if they didnt do anything take theem to this school:)
- Reviewed by Former Student on April 15, 2010
- Rating: (5 / 5) Flag as inappropriate
- My name is Dessie Watkins/Baird.
I went to Oyler and it was the best school ever. I love all the teachers and the principal was the best.
- Reviewed by Student on May 10, 2007
- Rating: (5 / 5) Flag as inappropriate
- To all you ppl reading this i want you to know my opinion about this school is that this school is the best! you get a lot of freedom and what nice friends you will meet! classes is cool and its just a great school to go to!
School Map and Similar Schools Nearby
Click to Activate Map of Nearby School Campuses
Private
Public
This School
Similar Schools Nearby
| Rees E. Price Elementary School PK-10 | 648 Students | 0.9 miles away | Not Yet Rated | |
| Virtual High School 8-12 | 293 Students | 1.6 miles away | Not Yet Rated | |
| Carson Elementary School PK-9 | 701 Students | 1.9 miles away | Not Yet Rated | |
| School for Creativity & Performing Arts High School 4-12 | 1,035 Students | 2.3 miles away |  3 out of 5 | |
| Hughes Stemm High School 7-11 | 290 Students | 2.4 miles away | Not Yet Rated | - |
| William H Taft Elementary School PK-9 | 266 Students | 2.7 miles away | Not Yet Rated | |
| Dater High School 7-12 | 792 Students | 2.9 miles away |  5 out of 5 | |
| Robert A Taft Information Technology High School 7-12 | 491 Students | 3.0 miles away | 3 out of 5 | |
| Western Hills Design Technology High School 7-12 | 572 Students | 3.0 miles away | Not Yet Rated | |
| Rockdale Academy Elementary School PK-9 | 440 Students | 3.9 miles away | Not Yet Rated | |
Compare This School To Nearby Schools ->
School Community Forum

Join a discussion about Oyler Elementary School and talk to others in the community including students, parents, teachers, and administrators.
Popular Discussion Topics
- Admissions and Registration Questions (e.g. Dress Code and Discipline Policy)
- School Calendar and Upcoming Events (e.g. Graduation)
- After School Programs, Extracurricular Activities, and Athletics (e.g. Football)
- News and Announcements (e.g. Yearbook and Class Supply List Details)
- Graduate and Alumni Events (e.g. Organizing Class Reunions)
Navigation
Can't Find What You Are Looking For?
Sponsored Links
K-12 Articles

Promoting Childhood Literacy
The number of American adults who are illiterate is astounding. People who lack the ability to read...
The number of American adults who are illiterate is astounding. People who lack the ability to read...

Break the Cycle: Teen Dating Violence and Prevention Week
February 5 through 9 was "National Teen Dating Violence Awareness and Prevention Week"....
February 5 through 9 was "National Teen Dating Violence Awareness and Prevention Week"....

Simple Math ... a Simple Gift
Math affects every aspect of our lives-from balancing the checkbook to estimating the amount of...
Math affects every aspect of our lives-from balancing the checkbook to estimating the amount of...