Leuzinger High School

5 out of 5 | 1 Review
Find Old Friends From Leuzinger High School
Use the form below to search for alumni from Leuzinger High School.
School Description
School Summary and Highlights
- Enrolls 2,574 high school students from grades 9-12
- Ranks 1125th out of 1,197 high schools in CA.
- 2010 Overall School AYP Met Status: No
Additional Contact Information
- Mailing Address: 4118 West Rosecrans Ave., Lawndale, CA 90260
School Operational Details
- Title I Eligible
School District Details
- Centinela Valley Union High School District
- Per-Pupil Spending: $8,780
- Dropout Rate: 5.9%
- Students Per Teacher: 22.6
- Enrolled Students: 6,767
Faculty Details and Student Enrollment
Students and Faculty
- Total Students Enrolled: 2,574
- Total Full Time "Equivalent" Teachers: 107.0
- Average Student-To-Teacher Ratio: 24.1
Students Gender Breakdown
- Males: 1,364 (53.0%)
- Females: 1,210 (47.0%)
Free Lunch Student Eligibility Breakdown
- Eligible for Reduced Lunch: 252 (9.8%)
- Eligible for Free Lunch: 1,878 (73.0%)
- Eligible for Either Reduced or Free Lunch: 2,130 (82.8%)
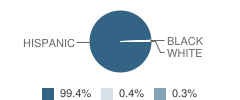
Student Enrollment Distribution by Race / Ethnicity

| Number | Percent | |
|---|---|---|
| American Indian | - | - |
| Black | 3 | 0.1% |
| Asian | - | - |
| Hispanic | 1,086 | 42.2% |
| White | 4 | 0.2% |
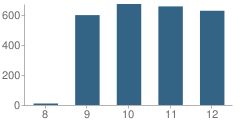
Number of Students Per Grade

| Number | Percent | |
|---|---|---|
| 8th Grade | 10 | 0.4% |
| 9th Grade | 599 | 23.3% |
| 10th Grade | 673 | 26.1% |
| 11th Grade | 657 | 25.5% |
| 12th Grade | 628 | 24.4% |
| Ungraded | 7 | 0.3% |
Graduates Information (2010)
Graduation Rate
School:
60.0%
District:
62.6%
State:
78.6%
Teacher Education Background (2009)
Percent With Ph.D.
School:
75.2%
District:
11.8%
Percent With Master's Degree
School:
21.8%
District:
35.3%
Percent With Bachelor's Degree: 14.3%
Teacher Credentials & Experience (2009)
Percent of Teachers With Emergency Credentials: 4.2%
Percent of Teachers With Credentials: 88.2%
Number of Certificated Staff: 133.0
Average Number of Years of Teacher Experience: 10.1
Average Age
School:
38.9
District:
50.8
Source: CA Department of Education, Source: NCES 2009-2010
Sponsored Links
Test Scores and Performance Information
Overall School Rating
How is this determined?
The overall school rating shows that Leuzinger High School performed on average much worse than most other schools across the state on CST state exams in the following subjects:
- CST Algebra I
- CST Algebra II
- CST Biology
- CST Chemistry
- CST Earth Science
- CST English-Language Arts
- CST General Mathematics
- CST Geometry
- CST Integrated/Coordinated Science
- CST Physics
- CST Science
- CST Summative High School Math
- CST U.S. History
- CST World History
AYP Results (2010)
Overall AYP Met: No
ELA AYP Met: No
Math AYP Met: No
Program Improvement (PI) Requirement Under NCLB (2010)
First Year PI Requirement was Implemented: 1999-2000
School's Placement Under NCLB: Year 5
ACT Exam Results (2009)
Percent of Students Taking ACT Exam: 5.7%
Average Combined Score: 17.3
Percent Scoring At or Above 21: 24.4%
SAT Exam Results (2009)
Percent of Students Taking SAT Exam: 31.1%
Average Combined Score: 1,186.4
Critical Reading Average: 395.0
Math Average: 397.8
Writing Average: 393.6
Percent Scoring At or Above 1500: 8.9%
CST - Test Proficiency by Grade and Subject
Grade 9 - % of students at or above proficiency
| School | District | State | |
|---|---|---|---|
| CST Algebra I Test | |||
| 2010 | 9.0% | 13.0% | 22.0% |
| 2009 | 26.0% | 34.0% | 21.0% |
| 2008 | 7.0% | 12.0% | 18.0% |
| CST Biology Test | |||
| 2010 | 14.0% | 27.0% | 55.0% |
| 2009 | 10.0% | 21.0% | 51.0% |
| 2008 | 10.0% | 18.0% | 52.0% |
| CST English-Language Arts Test | |||
| 2010 | 33.0% | 37.0% | 54.0% |
| 2009 | 21.0% | 30.0% | 50.0% |
| 2008 | 22.0% | 31.0% | 49.0% |
| CST Geometry Test | |||
| 2010 | 19.0% | 25.0% | 46.0% |
| 2009 | 33.0% | 36.0% | 47.0% |
| 2008 | 21.0% | 31.0% | 43.0% |
| CST General Mathematics Test | |||
| 2009 | 15.0% | 14.0% | 17.0% |
Grade 10 - % of students at or above proficiency
| School | District | State | |
|---|---|---|---|
| CST Algebra I Test | |||
| 2010 | 8.0% | 7.0% | 12.0% |
| 2009 | 4.0% | 3.0% | 11.0% |
| 2008 | 3.0% | 4.0% | 9.0% |
| CST Algebra II Test | |||
| 2010 | 26.0% | 35.0% | 40.0% |
| 2009 | 23.0% | 34.0% | 37.0% |
| 2008 | 16.0% | 30.0% | 36.0% |
| CST Biology Test | |||
| 2010 | 20.0% | 35.0% | 38.0% |
| 2009 | 7.0% | 26.0% | 34.0% |
| 2008 | 8.0% | 28.0% | 35.0% |
| CST Chemistry Test | |||
| 2010 | 20.0% | 39.0% | 47.0% |
| 2009 | 10.0% | 28.0% | 44.0% |
| 2008 | 27.0% | 39.0% | 41.0% |
| CST Earth Science Test | |||
| 2010 | 11.0% | 14.0% | 29.0% |
| 2009 | 4.0% | 6.0% | 23.0% |
| CST English-Language Arts Test | |||
| 2010 | 22.0% | 28.0% | 45.0% |
| 2009 | 16.0% | 25.0% | 44.0% |
| 2008 | 14.0% | 21.0% | 41.0% |
| CST Geometry Test | |||
| 2010 | 2.0% | 4.0% | 14.0% |
| 2009 | 6.0% | 7.0% | 14.0% |
| 2008 | 2.0% | 4.0% | 12.0% |
| CST Science Test | |||
| 2010 | 15.0% | 26.0% | 46.0% |
| 2009 | 12.0% | 23.0% | 44.0% |
| 2008 | 9.0% | 23.0% | 40.0% |
| CST World History Test | |||
| 2010 | 16.0% | 23.0% | 42.0% |
| 2009 | 6.0% | 17.0% | 38.0% |
| 2008 | 10.0% | 15.0% | 33.0% |
| CST Integrated/Coordinated Science Test | |||
| 2008 | 5.0% | 3.0% | 7.0% |
Grade 11 - % of students at or above proficiency
| School | District | State | |
|---|---|---|---|
| CST Algebra I Test | |||
| 2010 | 3.0% | 2.0% | 8.0% |
| 2009 | 5.0% | 4.0% | 8.0% |
| 2008 | 4.0% | 3.0% | 5.0% |
| CST Algebra II Test | |||
| 2010 | 3.0% | 7.0% | 14.0% |
| 2009 | 7.0% | 11.0% | 12.0% |
| 2008 | 6.0% | 11.0% | 11.0% |
| CST Biology Test | |||
| 2010 | 16.0% | 23.0% | 46.0% |
| 2009 | 8.0% | 24.0% | 41.0% |
| 2008 | 19.0% | 27.0% | 39.0% |
| CST Chemistry Test | |||
| 2010 | 12.0% | 23.0% | 30.0% |
| 2009 | 5.0% | 17.0% | 27.0% |
| 2008 | 8.0% | 15.0% | 25.0% |
| CST Earth Science Test | |||
| 2010 | 19.0% | 16.0% | 32.0% |
| CST English-Language Arts Test | |||
| 2010 | 19.0% | 26.0% | 42.0% |
| 2009 | 18.0% | 23.0% | 40.0% |
| 2008 | 14.0% | 19.0% | 37.0% |
| CST Geometry Test | |||
| 2010 | 1.0% | 1.0% | 6.0% |
| 2009 | 4.0% | 5.0% | 7.0% |
| 2008 | 1.0% | 1.0% | 6.0% |
| CST Summative High School Math Test | |||
| 2010 | 25.0% | 27.0% | 50.0% |
| 2009 | 28.0% | 41.0% | 47.0% |
| 2008 | 31.0% | 33.0% | 43.0% |
| CST U.S. History Test | |||
| 2010 | 20.0% | 27.0% | 45.0% |
| 2009 | 17.0% | 27.0% | 44.0% |
| 2008 | 15.0% | 27.0% | 38.0% |
| CST World History Test | |||
| 2010 | 4.0% | 9.0% | 15.0% |
| 2009 | 3.0% | 13.0% | 11.0% |
| 2008 | 9.0% | 9.0% | 9.0% |
| CST Physics Test | |||
| 2009 | 9.0% | 33.0% | 50.0% |
| 2008 | 25.0% | 53.0% | 47.0% |
| CST Integrated/Coordinated Science Test | |||
| 2008 | 4.0% | 4.0% | 10.0% |
End of Course - % of students at or above proficiency
| School | District | State | |
|---|---|---|---|
| CST Algebra I Test | |||
| 2010 | 8.0% | 10.0% | 31.0% |
| 2009 | 12.0% | 17.0% | 28.0% |
| 2008 | 5.0% | 8.0% | 25.0% |
| CST Algebra II Test | |||
| 2010 | 12.0% | 17.0% | 31.0% |
| 2009 | 14.0% | 19.0% | 28.0% |
| 2008 | 9.0% | 17.0% | 27.0% |
| CST Biology Test | |||
| 2010 | 15.0% | 29.0% | 46.0% |
| 2009 | 9.0% | 24.0% | 42.0% |
| 2008 | 10.0% | 24.0% | 42.0% |
| CST Chemistry Test | |||
| 2010 | 16.0% | 29.0% | 38.0% |
| 2009 | 7.0% | 22.0% | 36.0% |
| 2008 | 14.0% | 23.0% | 32.0% |
| CST Earth Science Test | |||
| 2010 | 14.0% | 19.0% | 33.0% |
| 2009 | 4.0% | 14.0% | 28.0% |
| CST Geometry Test | |||
| 2010 | 4.0% | 6.0% | 27.0% |
| 2009 | 11.0% | 13.0% | 26.0% |
| 2008 | 6.0% | 7.0% | 24.0% |
| CST Summative High School Math Test | |||
| 2010 | 25.0% | 27.0% | 54.0% |
| 2009 | 27.0% | 42.0% | 50.0% |
| 2008 | 37.0% | 37.0% | 47.0% |
| CST World History Test | |||
| 2010 | 15.0% | 22.0% | 41.0% |
| 2009 | 6.0% | 17.0% | 38.0% |
| 2008 | 9.0% | 15.0% | 33.0% |
| CST General Mathematics Test | |||
| 2009 | 15.0% | 14.0% | 26.0% |
| CST Physics Test | |||
| 2009 | 9.0% | 32.0% | 46.0% |
| 2008 | 25.0% | 55.0% | 43.0% |
| CST Integrated/Coordinated Science Test | |||
| 2008 | 4.0% | 3.0% | 11.0% |
Source: CA Department of Education 2009-2010
School Map and Similar Schools Nearby
Click to Activate Map of Nearby School Campuses
Private
Public
This School
Similar Schools Nearby
| Lawndale High School 9-12 | 1,556 Students | 0.6 miles away | ![]() 5 out of 5 | |
| Hawthorne High School 9-12 | 2,299 Students | 1.2 miles away | ![]() 5 out of 5 | |
| North High School 9-12 | 2,229 Students | 2.7 miles away | Not Yet Rated | |
| Mira Costa High School 9-12 | 2,424 Students | 2.8 miles away | Not Yet Rated | |
| Morningside High School 9-12 | 1,323 Students | 2.9 miles away | ![]() 4.5 out of 5 | |
| Middle College High School 9-12 | 379 Students | 3.1 miles away | Not Yet Rated | |
| George Washington Preparatory High School 9-12 | 2,130 Students | 3.7 miles away | ![]() 3.5 out of 5 | |
| West High School 9-12 | 2,076 Students | 3.9 miles away | Not Yet Rated | |
| El Segundo High School 9-12 | 1,228 Students | 3.9 miles away | ![]() 2.5 out of 5 | |
| City Honors High School 9-12 | 456 Students | 4.0 miles away | ![]() 5 out of 5 | |
Compare This School To Nearby Schools ->
School Community Forum

Join a discussion about Leuzinger High School and talk to others in the community including students, parents, teachers, and administrators.
Popular Discussion Topics
- Admissions and Registration Questions (e.g. Dress Code and Discipline Policy)
- School Calendar and Upcoming Events (e.g. Graduation)
- After School Programs, Extracurricular Activities, and Athletics (e.g. Football)
- News and Announcements (e.g. Yearbook and Class Supply List Details)
- Graduate and Alumni Events (e.g. Organizing Class Reunions)
Navigation
Can't Find What You Are Looking For?
Rankings
Nearby Cities
Sponsored Links
K-12 Articles
It's the Most Wonderful Time of the Year!
For most of the country, school is starting up this week or later this month-at the beginning of...
Teach Your Child to Write Well
When American children head off to junior kindergarten, they must be ready to learn. It is your...
Exciting School Lunch Ideas
Earlier this week I had reason to drop by my grandsons' school at lunch time. While waiting for the...


(5 / 5) 


