Lawndale High School
14901 South Inglewood Ave, Lawndale, CA 90260 | (310) 263-3100
- Grades: 9-12
- Student Enrollment: 1,556
Rating
Not Available
Not Available

5 out of 5 | 2 Reviews
Find Old Friends From Lawndale High School
Use the form below to search for alumni from Lawndale High School.
School Description
School Summary and Highlights
- Enrolls 1,556 high school students from grades 9-12
- Ranks 520th out of 1,197 high schools in CA.
- 2010 Overall School AYP Met Status: No
Additional Contact Information
- Mailing Address: 14901 South Inglewood Ave., Lawndale, CA 90260
School Operational Details
- Title I Eligible
School District Details
- Centinela Valley Union High School District
- Per-Pupil Spending: $8,780
- Dropout Rate: 5.9%
- Students Per Teacher: 22.6
- Enrolled Students: 6,767
Faculty Details and Student Enrollment
Students and Faculty
- Total Students Enrolled: 1,556
- Total Full Time "Equivalent" Teachers: 67.0
- Average Student-To-Teacher Ratio: 23.2
Students Gender Breakdown
- Males: 791 (50.8%)
- Females: 765 (49.2%)
Free Lunch Student Eligibility Breakdown
- Eligible for Reduced Lunch: 297 (19.1%)
- Eligible for Free Lunch: 918 (59.0%)
- Eligible for Either Reduced or Free Lunch: 1,215 (78.1%)
Student Enrollment Distribution by Race / Ethnicity
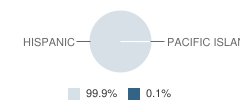
| Number | Percent | |
|---|---|---|
| American Indian | - | - |
| Black | - | - |
| Asian | - | - |
| Hispanic | 1,140 | 73.3% |
| White | - | - |
Number of Students Per Grade
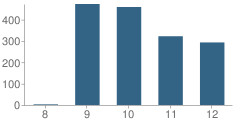
| Number | Percent | |
|---|---|---|
| 8th Grade | 3 | 0.2% |
| 9th Grade | 473 | 30.4% |
| 10th Grade | 459 | 29.5% |
| 11th Grade | 322 | 20.7% |
| 12th Grade | 293 | 18.8% |
| Ungraded | 6 | 0.4% |
Graduates Information (2010)
Graduation Rate
School:
81.6%
District:
62.6%
State:
78.6%
Teacher Education Background (2009)
Percent With Ph.D.
School:
1.5%
District:
11.8%
Percent With Master's Degree
School:
34.3%
District:
35.3%
Percent With Bachelor's Degree: 17.9%
Teacher Credentials & Experience (2009)
Percent of Teachers With Credentials: 86.9%
Number of Certificated Staff: 67.0
Average Number of Years of Teacher Experience: 7.3
Average Age
School:
32.6
District:
50.8
Source: CA Department of Education, Source: NCES 2009-2010
School Ratings and Reviews
Overall Rating: 5

5 out of 5 | 2 Reviews
The Overall Rating is the school's average rating from parents, students, school faculty and staff. The highest rating is five apples and the lowest is one apple.
Share Your Review About This School
2 reviews for Lawndale High School
- Reviewed by Parent/Guardian on January 05, 2010
- Rating:
 (5 / 5) Flag as inappropriate
 - i am amazed with the school and the no D policy!
- Reviewed by Student on January 20, 2009
- Rating: (5 / 5) Flag as inappropriate
- Lanwdale has some excellent teachers that actually take an interest in the students making school a lot easier to deal with. Lawndale has many great programs in which a student could be a part of and I am proud to say i went there.
School Map and Similar Schools Nearby
Click to Activate Map of Nearby School Campuses
Private
Public
This School
Similar Schools Nearby
| Leuzinger High School 9-12 | 2,574 Students | 0.6 miles away |  5 out of 5 | |
| Hawthorne High School 9-12 | 2,299 Students | 1.4 miles away | 5 out of 5 | |
| Mira Costa High School 9-12 | 2,424 Students | 2.2 miles away | Not Yet Rated | |
| North High School 9-12 | 2,229 Students | 2.6 miles away | Not Yet Rated | |
| Morningside High School 9-12 | 1,323 Students | 3.4 miles away |  4.5 out of 5 | |
| West High School 9-12 | 2,076 Students | 3.5 miles away | Not Yet Rated | |
| El Segundo High School 9-12 | 1,228 Students | 3.7 miles away |  2.5 out of 5 | |
| Middle College High School 9-12 | 379 Students | 3.7 miles away | Not Yet Rated | |
| Redondo High School 9-12 | 2,560 Students | 3.8 miles away | Not Yet Rated | |
| Gardena High School 9-12 | 2,806 Students | 4.2 miles away | Not Yet Rated | |
Compare This School To Nearby Schools ->
School Community Forum

Join a discussion about Lawndale High School and talk to others in the community including students, parents, teachers, and administrators.
Popular Discussion Topics
- Admissions and Registration Questions (e.g. Dress Code and Discipline Policy)
- School Calendar and Upcoming Events (e.g. Graduation)
- After School Programs, Extracurricular Activities, and Athletics (e.g. Football)
- News and Announcements (e.g. Yearbook and Class Supply List Details)
- Graduate and Alumni Events (e.g. Organizing Class Reunions)
Navigation
Can't Find What You Are Looking For?
Rankings
Nearby Cities
Sponsored Links
K-12 Articles

Exciting School Lunch Ideas
Earlier this week I had reason to drop by my grandsons' school at lunch time. While waiting for the...
Earlier this week I had reason to drop by my grandsons' school at lunch time. While waiting for the...

School's out for Recess
Recess used to be the best part of school; that and lunch. But today, a shocking two-thirds of...
Recess used to be the best part of school; that and lunch. But today, a shocking two-thirds of...

Keep Your Licensed Teen Safe This Summer
Every year hundreds of teenage drivers lose their lives in motor vehicle accidents. Statistics show...
Every year hundreds of teenage drivers lose their lives in motor vehicle accidents. Statistics show...