George B. Miller Elementary School
Rating
Not Available
Not Available

5 out of 5 | 2 Reviews
Find Old Friends From George B. Miller Elementary School
Use the form below to search for alumni from George B. Miller Elementary School.
School Description
School Summary and Highlights
- Enrolls 518 elementary school students from grades KG-6
- Ranks 1147th out of 5,423 elementary schools in CA.
- 2010 Overall School AYP Met Status: Yes
Additional Contact Information
- Mailing Address: 7751 Furman Rd., La Palma, CA 90623
School District Details
- Centralia Elementary School District
- Per-Pupil Spending: $8,894
- Students Per Teacher: 25.4
- Enrolled Students: 4,557
Faculty Details and Student Enrollment
Students and Faculty
- Total Students Enrolled: 518
- Total Full Time "Equivalent" Teachers: 20.4
- Average Student-To-Teacher Ratio: 25.4
Students Gender Breakdown
- Males: 264 (51.0%)
- Females: 254 (49.0%)
Free Lunch Student Eligibility Breakdown
- Eligible for Reduced Lunch: 67 (12.9%)
- Eligible for Free Lunch: 96 (18.5%)
- Eligible for Either Reduced or Free Lunch: 163 (31.5%)
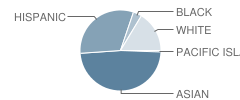
Student Enrollment Distribution by Race / Ethnicity
| Number | Percent | |
|---|---|---|
| American Indian | - | - |
| Black | 17 | 3.3% |
| Asian | 239 | 46.1% |
| Hispanic | 155 | 29.9% |
| White | 81 | 15.6% |
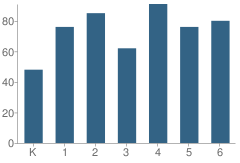
Number of Students Per Grade
| Number | Percent | |
|---|---|---|
| Kindergarten | 48 | 9.3% |
| 1st Grade | 76 | 14.7% |
| 2nd Grade | 85 | 16.4% |
| 3rd Grade | 62 | 12.0% |
| 4th Grade | 91 | 17.6% |
| 5th Grade | 76 | 14.7% |
| 6th Grade | 80 | 15.4% |
Teacher Education Background (2009)
Percent With Master's Degree
School:
61.5%
District:
41.7%
Teacher Credentials & Experience (2009)
Percent of Teachers With Credentials: 100.0%
Number of Certificated Staff: 26.0
Average Number of Years of Teacher Experience: 12.7
Average Age
School:
38.4
District:
42.9
Source: CA Department of Education, Source: NCES 2009-2010
School Ratings and Reviews
Overall Rating: 5

5 out of 5 | 2 Reviews
The Overall Rating is the school's average rating from parents, students, school faculty and staff. The highest rating is five apples and the lowest is one apple.
Share Your Review About This School
2 reviews for George B. Miller Elementary School
- Reviewed by Parent/Guardian on October 22, 2008
- Rating:
 (5 / 5) Flag as inappropriate
 - 5
- Reviewed by Former Student on February 16, 2007
- Rating: (5 / 5) Flag as inappropriate
- George B. Miller is an outstanding school. If you send your child somewhere else, then you are making the biggest mistake of your life. Miller has great teachers and the lunches aren't too bad.
Class of
'05-'06
School Map and Similar Schools Nearby
Click to Activate Map of Nearby School Campuses
Private
Public
This School
Similar Schools Nearby
| Los Coyotes Elementary School KG-6 | 519 Students | 0.7 miles away | Not Yet Rated | |
| Raymond Temple Elementary School KG-6 | 338 Students | 0.8 miles away | Not Yet Rated | |
| Arthur F. Corey Elementary School KG-6 | 618 Students | 0.8 miles away |  5 out of 5 | |
| Buena Terra Elementary School KG-6 | 392 Students | 0.9 miles away | 5 out of 5 | |
| San Marino Elementary School KG-6 | 567 Students | 0.9 miles away | Not Yet Rated | |
| Steve Luther Elementary School KG-6 | 389 Students | 1.0 miles away | 5 out of 5 | |
| Clara J. King Elementary School KG-6 | 483 Students | 1.2 miles away | Not Yet Rated | |
| Cerritos Elementary School KG-6 | 612 Students | 1.2 miles away | Not Yet Rated | |
| Christine P. Swain Elementary School KG-6 | 409 Students | 1.4 miles away | Not Yet Rated | |
| Frank C. Leal Elementary School KG-6 | 706 Students | 1.5 miles away | 5 out of 5 | |
Compare This School To Nearby Schools ->
School Community Forum

Join a discussion about George B. Miller Elementary School and talk to others in the community including students, parents, teachers, and administrators.
Popular Discussion Topics
- Admissions and Registration Questions (e.g. Dress Code and Discipline Policy)
- School Calendar and Upcoming Events (e.g. Graduation)
- After School Programs, Extracurricular Activities, and Athletics (e.g. Football)
- News and Announcements (e.g. Yearbook and Class Supply List Details)
- Graduate and Alumni Events (e.g. Organizing Class Reunions)
Navigation
Can't Find What You Are Looking For?
Rankings
Nearby Cities
Sponsored Links
K-12 Articles

Teaching Children a Love of History
Parents and grandparents are responsible for teaching children a love of history. To begin, relate...
Parents and grandparents are responsible for teaching children a love of history. To begin, relate...

Everyone Loves Going to the Doctor and Dentist
Going to the doctor or dentist can be traumatic for children of all ages. Many adults do not...
Going to the doctor or dentist can be traumatic for children of all ages. Many adults do not...

Summer Advice
A few weeks ago, at the weekly after-school program I run through my local church, a group of...
A few weeks ago, at the weekly after-school program I run through my local church, a group of...