Montclair High School
Rating
Not Available
Not Available

3 out of 5 | 3 Reviews
Find Old Friends From Montclair High School
Use the form below to search for alumni from Montclair High School.
School Description
School Summary and Highlights
- Enrolls 3,221 high school students from grades 9-12
- Ranks 702nd out of 1,197 high schools in CA.
- 2010 Overall School AYP Met Status: No
Additional Contact Information
- Mailing Address: 4725 Benito St., Montclair, CA 91763
School Operational Details
- Title I EligibleAll students of this school are eligible for participation in authorized programs.
School District Details
- Chaffey Joint Union High School District
- Per-Pupil Spending: $8,140
- Dropout Rate: 3.2%
- Students Per Teacher: 25.9
- Enrolled Students: 25,367
Faculty Details and Student Enrollment
Students and Faculty
- Total Students Enrolled: 3,221
- Total Full Time "Equivalent" Teachers: 125.8
- Average Student-To-Teacher Ratio: 25.6
Students Gender Breakdown
- Males: 1,642 (51.0%)
- Females: 1,579 (49.0%)
Free Lunch Student Eligibility Breakdown
- Eligible for Reduced Lunch: 243 (7.5%)
- Eligible for Free Lunch: 1,900 (59.0%)
- Eligible for Either Reduced or Free Lunch: 2,143 (66.5%)
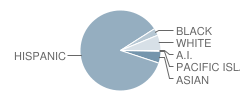
Student Enrollment Distribution by Race / Ethnicity
| Number | Percent | |
|---|---|---|
| American Indian | 8 | 0.2% |
| Black | 94 | 2.9% |
| Asian | 154 | 4.8% |
| Hispanic | 2,752 | 85.4% |
| White | 200 | 6.2% |
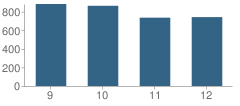
Number of Students Per Grade
| Number | Percent | |
|---|---|---|
| 9th Grade | 882 | 27.4% |
| 10th Grade | 863 | 26.8% |
| 11th Grade | 735 | 22.8% |
| 12th Grade | 741 | 23.0% |
Graduates Information (2010)
Graduation Rate
School:
82.5%
District:
82.2%
State:
78.6%
Teacher Education Background (2009)
Percent With Master's Degree
School:
14.6%
District:
8.3%
Percent With Bachelor's Degree
School:
11.1%
District:
8.3%
Percent With Ph.D.
School:
4.9%
District:
8.3%
Teacher Credentials & Experience (2009)
Average Age
School:
40.7
District:
48.3
Average Number of Years of Teacher Experience: 12.0
Number of Certificated Staff: 144.0
Percent of Teachers With Credentials: 96.1%
Source: CA Department of Education, Source: NCES 2009-2010
School Ratings and Reviews
Overall Rating: 3

3 out of 5 | 3 Reviews
The Overall Rating is the school's average rating from parents, students, school faculty and staff. The highest rating is five apples and the lowest is one apple.
Share Your Review About This School
3 reviews for Montclair High School
- Reviewed by Student on March 15, 2011
- Rating:
 (4 / 5) Flag as inappropriate
 - Great school!
- Reviewed by Parent/Guardian on July 14, 2010
- Rating:
 (1 / 5) Flag as inappropriate
 - This school is a joke they spent 5 million to upgrade. They should spend it on security my son got jumped twice on the side of this school. Where was the security at 3:05 pm? Fortunately, both times he was able to defend himself. These guys werrn't even from the school or other highschools they were grown men. My son finally graduated this year and I pulled the other out. Good riddens! My family grew up here, my grandkids will definitely be going to Upland.
- Reviewed by Student on October 01, 2007
- Rating: (4 / 5) Flag as inappropriate
- This school is getting better. Supposedly, they spent well over 5 million fixing it up and yes, it does looks nice.
Hopefully the other students can appreciate what a nice school we have.
School Map and Similar Schools Nearby
Click to Activate Map of Nearby School Campuses
Private
Public
This School
Similar Schools Nearby
| Pomona High School 9-12 | 1,774 Students | 2.4 miles away |  4.5 out of 5 | |
| Claremont High School 9-12 | 2,401 Students | 2.9 miles away | Not Yet Rated | |
| Chaffey High School 9-12 | 3,645 Students | 2.9 miles away | Not Yet Rated | |
| Ontario High School 9-12 | 2,943 Students | 3.1 miles away |  5 out of 5 | |
| Ramona Junior High School 7-8 | 887 Students | 3.3 miles away | 4.5 out of 5 | |
| Upland High School 9-12 | 3,709 Students | 3.4 miles away | 5 out of 5 | |
| Chino High School 9-12 | 2,767 Students | 3.8 miles away | Not Yet Rated | |
| Garey High School 9-12 | 2,100 Students | 3.8 miles away |  4 out of 5 | |
| Bonita High School 9-12 | 1,985 Students | 4.4 miles away | Not Yet Rated | |
| Don Antonio Lugo High School 9-12 | 2,290 Students | 4.5 miles away | Not Yet Rated | |
Compare This School To Nearby Schools ->
School Community Forum

Join a discussion about Montclair High School and talk to others in the community including students, parents, teachers, and administrators.
Popular Discussion Topics
- Admissions and Registration Questions (e.g. Dress Code and Discipline Policy)
- School Calendar and Upcoming Events (e.g. Graduation)
- After School Programs, Extracurricular Activities, and Athletics (e.g. Football)
- News and Announcements (e.g. Yearbook and Class Supply List Details)
- Graduate and Alumni Events (e.g. Organizing Class Reunions)
Navigation
Can't Find What You Are Looking For?
Rankings
Nearby Cities
Sponsored Links
K-12 Articles

Helping Your Child Leave the Nest
It’s all come down to this: Eighteen years of good times and bad, and now your baby bird is ready...
It’s all come down to this: Eighteen years of good times and bad, and now your baby bird is ready...

The Cervical Cancer Vaccine
All across North America girls between the ages of 11 and 12 have the opportunity to be vaccinated...
All across North America girls between the ages of 11 and 12 have the opportunity to be vaccinated...

The Most Used Form of Communication
Writing has, quite surprisingly, become more and more important in today’s electronic society....
Writing has, quite surprisingly, become more and more important in today’s electronic society....