Ontario High School
Rating
Not Available
Not Available

5 out of 5 | 2 Reviews
Find Old Friends From Ontario High School
Use the form below to search for alumni from Ontario High School.
School Description
School Summary and Highlights
- Enrolls 2,943 high school students from grades 9-12
- Ranks 674th out of 1,197 high schools in CA.
- 2010 Overall School AYP Met Status: No
Additional Contact Information
- Mailing Address: 901 West Francis St., Ontario, CA 91762
School Operational Details
- Title I EligibleAll students of this school are eligible for participation in authorized programs.
School District Details
- Chaffey Joint Union High School District
- Per-Pupil Spending: $8,140
- Dropout Rate: 3.2%
- Students Per Teacher: 25.9
- Enrolled Students: 25,367
Faculty Details and Student Enrollment
Students and Faculty
- Total Students Enrolled: 2,943
- Total Full Time "Equivalent" Teachers: 113.4
- Average Student-To-Teacher Ratio: 26.0
Students Gender Breakdown
- Males: 1,498 (50.9%)
- Females: 1,445 (49.1%)
Free Lunch Student Eligibility Breakdown
- Eligible for Reduced Lunch: 196 (6.7%)
- Eligible for Free Lunch: 1,657 (56.3%)
- Eligible for Either Reduced or Free Lunch: 1,853 (63.0%)
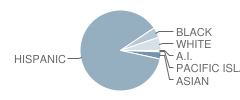
Student Enrollment Distribution by Race / Ethnicity
| Number | Percent | |
|---|---|---|
| American Indian | 7 | 0.2% |
| Black | 122 | 4.1% |
| Asian | 86 | 2.9% |
| Hispanic | 2,553 | 86.7% |
| White | 157 | 5.3% |
Number of Students Per Grade

| Number | Percent | |
|---|---|---|
| 9th Grade | 765 | 26.0% |
| 10th Grade | 773 | 26.3% |
| 11th Grade | 720 | 24.5% |
| 12th Grade | 685 | 23.3% |
Graduates Information (2010)
Graduation Rate
School:
79.8%
District:
82.2%
State:
78.6%
Teacher Education Background (2009)
Percent With Master's Degree
School:
10.7%
District:
8.3%
Percent With Bachelor's Degree
School:
7.6%
District:
8.3%
Teacher Credentials & Experience (2009)
Percent of Teachers With Emergency Credentials: 1.7%
Percent of Teachers With Credentials: 99.1%
Number of Certificated Staff: 131.0
Average Number of Years of Teacher Experience: 14.9
Average Age
School:
44.1
District:
48.3
Source: CA Department of Education, Source: NCES 2009-2010
School Ratings and Reviews
Overall Rating: 5

5 out of 5 | 2 Reviews
The Overall Rating is the school's average rating from parents, students, school faculty and staff. The highest rating is five apples and the lowest is one apple.
Share Your Review About This School
2 reviews for Ontario High School
- Reviewed by Student on January 29, 2011
- Rating:
 (5 / 5) Flag as inappropriate
 - this is the best school ever
- Reviewed by Student on May 16, 2007
- Rating: (5 / 5) Flag as inappropriate
- ontario is the best!
School Map and Similar Schools Nearby
Click to Activate Map of Nearby School Campuses
Private
Public
This School
Similar Schools Nearby
| Chino High School 9-12 | 2,767 Students | 1.8 miles away | Not Yet Rated | |
| Woodcrest Junior High School 7-8 | 508 Students | 1.8 miles away |  5 out of 5 | |
| Magnolia Junior High School 7-8 | 920 Students | 1.8 miles away | 5 out of 5 | |
| Ramona Junior High School 7-8 | 887 Students | 2.5 miles away |  4.5 out of 5 | |
| Chaffey High School 9-12 | 3,645 Students | 2.9 miles away | Not Yet Rated | |
| Montclair High School 9-12 | 3,221 Students | 3.1 miles away |  3 out of 5 | |
| Don Antonio Lugo High School 9-12 | 2,290 Students | 3.6 miles away | Not Yet Rated | |
| Upland High School 9-12 | 3,709 Students | 4.5 miles away | 5 out of 5 | |
| Garey High School 9-12 | 2,100 Students | 4.9 miles away |  4 out of 5 | |
| Ruben S. Ayala High School 9-12 | 2,478 Students | 5.0 miles away | Not Yet Rated | |
Compare This School To Nearby Schools ->
School Community Forum

Join a discussion about Ontario High School and talk to others in the community including students, parents, teachers, and administrators.
Popular Discussion Topics
- Admissions and Registration Questions (e.g. Dress Code and Discipline Policy)
- School Calendar and Upcoming Events (e.g. Graduation)
- After School Programs, Extracurricular Activities, and Athletics (e.g. Football)
- News and Announcements (e.g. Yearbook and Class Supply List Details)
- Graduate and Alumni Events (e.g. Organizing Class Reunions)
Navigation
Can't Find What You Are Looking For?
Rankings
Nearby Cities
Sponsored Links
K-12 Articles

Preparing Your Child for the First Day of School
It seems like school was just dismissed for the summer, yet here we are facing another year of back...
It seems like school was just dismissed for the summer, yet here we are facing another year of back...

Summer Advice
A few weeks ago, at the weekly after-school program I run through my local church, a group of...
A few weeks ago, at the weekly after-school program I run through my local church, a group of...

Keep Morning Stress at a Minimum: Establish a Routine
Morning! It can be a time of stress. The kids are fighting over who gets to use the bathroom first,...
Morning! It can be a time of stress. The kids are fighting over who gets to use the bathroom first,...