Rancho Cucamonga High School

4 out of 5 | 1 Review
Find Old Friends From Rancho Cucamonga High School
Use the form below to search for alumni from Rancho Cucamonga High School.
School Description
School Summary and Highlights
- Enrolls 3,071 high school students from grades 9-12
- Ranks 275th out of 1,197 high schools in CA.
- 2010 Overall School AYP Met Status: No
Additional Contact Information
- Mailing Address: 11801 Lark Dr., Rancho Cucamonga, CA 91701
School District Details
- Chaffey Joint Union High School District
- Per-Pupil Spending: $8,140
- Dropout Rate: 3.2%
- Students Per Teacher: 25.9
- Enrolled Students: 25,367
Faculty Details and Student Enrollment
Students and Faculty
- Total Students Enrolled: 3,071
- Total Full Time "Equivalent" Teachers: 107.8
- Average Student-To-Teacher Ratio: 28.5
Students Gender Breakdown
- Males: 1,530 (49.8%)
- Females: 1,541 (50.2%)
Free Lunch Student Eligibility Breakdown
- Eligible for Reduced Lunch: 237 (7.7%)
- Eligible for Free Lunch: 556 (18.1%)
- Eligible for Either Reduced or Free Lunch: 793 (25.8%)
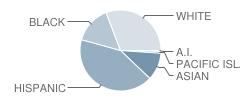
Student Enrollment Distribution by Race / Ethnicity

| Number | Percent | |
|---|---|---|
| American Indian | 16 | 0.5% |
| Black | 448 | 14.6% |
| Asian | 333 | 10.8% |
| Hispanic | 1,258 | 41.0% |
| White | 920 | 30.0% |
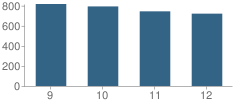
Number of Students Per Grade

| Number | Percent | |
|---|---|---|
| 9th Grade | 816 | 26.6% |
| 10th Grade | 792 | 25.8% |
| 11th Grade | 743 | 24.2% |
| 12th Grade | 720 | 23.4% |
Graduates Information (2010)
Graduation Rate
School:
93.4%
District:
82.2%
State:
78.6%
Teacher Education Background (2009)
Percent With Ph.D.
School:
75.8%
District:
8.3%
Percent With Master's Degree
School:
9.1%
District:
8.3%
Percent With Bachelor's Degree
School:
1.5%
District:
8.3%
Teacher Credentials & Experience (2009)
Percent of Teachers With Emergency Credentials: 0.9%
Percent of Teachers With Credentials: 100.0%
Number of Certificated Staff: 132.0
Average Number of Years of Teacher Experience: 15.2
Average Age
School:
40.5
District:
48.3
Source: CA Department of Education, Source: NCES 2009-2010
Sponsored Links
Test Scores and Performance Information
Overall School Rating
How is this determined?
The overall school rating shows that Rancho Cucamonga High School performed on average better than many other schools across the state on CST state exams in the following subjects:
- CST Algebra I
- CST Algebra II
- CST Biology
- CST Chemistry
- CST Earth Science
- CST English-Language Arts
- CST Geometry
- CST Physics
- CST Science
- CST Summative High School Math
- CST U.S. History
- CST World History
AYP Results (2010)
Overall AYP Met: No
ELA AYP Met: No
Math AYP Met: No
ACT Exam Results (2009)
Percent of Students Taking ACT Exam: 6.9%
Average Combined Score: 22.5
Percent Scoring At or Above 21: 61.4%
SAT Exam Results (2009)
Percent of Students Taking SAT Exam: 38.9%
Average Combined Score: 1,503.4
Critical Reading Average: 494.4
Math Average: 516.1
Writing Average: 492.9
Percent Scoring At or Above 1500: 51.2%
CST - Test Proficiency by Grade and Subject
Grade 9 - % of students at or above proficiency
| School | District | State | |
|---|---|---|---|
| CST Algebra I Test | |||
| 2010 | 33.0% | 29.0% | 22.0% |
| 2009 | 21.0% | 25.0% | 21.0% |
| 2008 | 19.0% | 20.0% | 18.0% |
| CST Earth Science Test | |||
| 2010 | 61.0% | 40.0% | 35.0% |
| 2009 | 56.0% | 34.0% | 29.0% |
| 2008 | 52.0% | 36.0% | 31.0% |
| CST English-Language Arts Test | |||
| 2010 | 70.0% | 56.0% | 54.0% |
| 2009 | 67.0% | 51.0% | 50.0% |
| 2008 | 63.0% | 49.0% | 49.0% |
| CST Geometry Test | |||
| 2010 | 58.0% | 68.0% | 46.0% |
| 2009 | 58.0% | 68.0% | 47.0% |
| 2008 | 60.0% | 63.0% | 43.0% |
| CST World History Test | |||
| 2008 | 33.0% | 6.0% | 36.0% |
Grade 10 - % of students at or above proficiency
| School | District | State | |
|---|---|---|---|
| CST Algebra I Test | |||
| 2010 | 6.0% | 9.0% | 12.0% |
| 2009 | 6.0% | 11.0% | 11.0% |
| 2008 | 4.0% | 9.0% | 9.0% |
| CST Algebra II Test | |||
| 2010 | 52.0% | 62.0% | 40.0% |
| 2009 | 54.0% | 60.0% | 37.0% |
| 2008 | 51.0% | 58.0% | 36.0% |
| CST Biology Test | |||
| 2010 | 52.0% | 39.0% | 38.0% |
| 2009 | 49.0% | 34.0% | 34.0% |
| 2008 | 49.0% | 36.0% | 35.0% |
| CST Earth Science Test | |||
| 2010 | 23.0% | 31.0% | 29.0% |
| 2009 | 32.0% | 32.0% | 23.0% |
| 2008 | 36.0% | 28.0% | 23.0% |
| CST English-Language Arts Test | |||
| 2010 | 61.0% | 45.0% | 45.0% |
| 2009 | 56.0% | 44.0% | 44.0% |
| 2008 | 54.0% | 42.0% | 41.0% |
| CST Geometry Test | |||
| 2010 | 10.0% | 17.0% | 14.0% |
| 2009 | 12.0% | 16.0% | 14.0% |
| 2008 | 10.0% | 15.0% | 12.0% |
| CST Science Test | |||
| 2010 | 65.0% | 48.0% | 46.0% |
| 2009 | 63.0% | 47.0% | 44.0% |
| 2008 | 50.0% | 42.0% | 40.0% |
| CST World History Test | |||
| 2010 | 62.0% | 45.0% | 42.0% |
| 2009 | 56.0% | 42.0% | 38.0% |
| 2008 | 49.0% | 40.0% | 33.0% |
| CST Chemistry Test | |||
| 2009 | 15.0% | 61.0% | 44.0% |
| 2008 | 8.0% | 58.0% | 41.0% |
Grade 11 - % of students at or above proficiency
| School | District | State | |
|---|---|---|---|
| CST Algebra I Test | |||
| 2010 | 2.0% | 5.0% | 8.0% |
| 2009 | 4.0% | 5.0% | 8.0% |
| 2008 | 5.0% | 5.0% | 5.0% |
| CST Algebra II Test | |||
| 2010 | 9.0% | 17.0% | 14.0% |
| 2009 | 12.0% | 16.0% | 12.0% |
| 2008 | 12.0% | 17.0% | 11.0% |
| CST Biology Test | |||
| 2010 | 60.0% | 50.0% | 46.0% |
| 2009 | 55.0% | 46.0% | 41.0% |
| 2008 | 48.0% | 35.0% | 39.0% |
| CST Chemistry Test | |||
| 2010 | 49.0% | 32.0% | 30.0% |
| 2009 | 43.0% | 32.0% | 27.0% |
| 2008 | 43.0% | 27.0% | 25.0% |
| CST Earth Science Test | |||
| 2010 | 77.0% | 49.0% | 32.0% |
| 2009 | 69.0% | 38.0% | 26.0% |
| 2008 | 68.0% | 41.0% | 28.0% |
| CST English-Language Arts Test | |||
| 2010 | 57.0% | 42.0% | 42.0% |
| 2009 | 53.0% | 41.0% | 40.0% |
| 2008 | 49.0% | 36.0% | 37.0% |
| CST Geometry Test | |||
| 2010 | 2.0% | 5.0% | 6.0% |
| 2009 | 2.0% | 6.0% | 7.0% |
| 2008 | 3.0% | 5.0% | 6.0% |
| CST Physics Test | |||
| 2010 | 73.0% | 59.0% | 53.0% |
| 2009 | 51.0% | 51.0% | 50.0% |
| 2008 | 75.0% | 56.0% | 47.0% |
| CST Summative High School Math Test | |||
| 2010 | 53.0% | 59.0% | 50.0% |
| 2009 | 54.0% | 55.0% | 47.0% |
| 2008 | 34.0% | 44.0% | 43.0% |
| CST U.S. History Test | |||
| 2010 | 66.0% | 50.0% | 45.0% |
| 2009 | 66.0% | 49.0% | 44.0% |
| 2008 | 53.0% | 42.0% | 38.0% |
| CST World History Test | |||
| 2008 | 14.0% | 5.0% | 9.0% |
End of Course - % of students at or above proficiency
| School | District | State | |
|---|---|---|---|
| CST Algebra I Test | |||
| 2010 | 25.0% | 21.0% | 31.0% |
| 2009 | 16.0% | 19.0% | 28.0% |
| 2008 | 14.0% | 15.0% | 25.0% |
| CST Algebra II Test | |||
| 2010 | 31.0% | 35.0% | 31.0% |
| 2009 | 33.0% | 33.0% | 28.0% |
| 2008 | 33.0% | 35.0% | 27.0% |
| CST Biology Test | |||
| 2010 | 54.0% | 45.0% | 46.0% |
| 2009 | 51.0% | 41.0% | 42.0% |
| 2008 | 49.0% | 41.0% | 42.0% |
| CST Chemistry Test | |||
| 2010 | 47.0% | 41.0% | 38.0% |
| 2009 | 41.0% | 41.0% | 36.0% |
| 2008 | 39.0% | 35.0% | 32.0% |
| CST Earth Science Test | |||
| 2010 | 62.0% | 41.0% | 33.0% |
| 2009 | 57.0% | 35.0% | 28.0% |
| 2008 | 53.0% | 36.0% | 28.0% |
| CST Geometry Test | |||
| 2010 | 31.0% | 27.0% | 27.0% |
| 2009 | 28.0% | 27.0% | 26.0% |
| 2008 | 28.0% | 25.0% | 24.0% |
| CST Physics Test | |||
| 2010 | 73.0% | 59.0% | 49.0% |
| 2009 | 52.0% | 52.0% | 46.0% |
| 2008 | 72.0% | 55.0% | 43.0% |
| CST Summative High School Math Test | |||
| 2010 | 54.0% | 59.0% | 54.0% |
| 2009 | 55.0% | 56.0% | 50.0% |
| 2008 | 34.0% | 44.0% | 47.0% |
| CST World History Test | |||
| 2010 | 62.0% | 45.0% | 41.0% |
| 2009 | 55.0% | 41.0% | 38.0% |
| 2008 | 49.0% | 39.0% | 33.0% |
Source: CA Department of Education 2009-2010
School Map and Similar Schools Nearby
Click to Activate Map of Nearby School Campuses
Private
Public
This School
Similar Schools Nearby
| Los Osos High School 9-12 | 3,262 Students | 0.9 miles away | Not Yet Rated | |
| Vineyard Junior High School 7-8 | 834 Students | 1.7 miles away | ![]() 4.5 out of 5 | |
| Etiwanda High School 9-12 | 3,312 Students | 2.3 miles away | Not Yet Rated | |
| Alta Loma Jr. High School 7-8 | 822 Students | 3.4 miles away | Not Yet Rated | |
| Alta Loma High School 9-12 | 2,662 Students | 3.5 miles away | Not Yet Rated | |
| Pioneer Junior High School 7-8 | 973 Students | 5.9 miles away | Not Yet Rated | |
| Upland High School 9-12 | 3,709 Students | 6.3 miles away | ![]() 4 out of 5 | |
| Chaffey High School 9-12 | 3,645 Students | 6.8 miles away | Not Yet Rated | |
| Colony High School 9-12 | 2,285 Students | 8.0 miles away | ![]() 4 out of 5 | |
| Woodcrest Junior High School 7-8 | 508 Students | 9.1 miles away | ![]() 5 out of 5 | |
Compare This School To Nearby Schools ->
School Community Forum

Join a discussion about Rancho Cucamonga High School and talk to others in the community including students, parents, teachers, and administrators.
Popular Discussion Topics
- Admissions and Registration Questions (e.g. Dress Code and Discipline Policy)
- School Calendar and Upcoming Events (e.g. Graduation)
- After School Programs, Extracurricular Activities, and Athletics (e.g. Football)
- News and Announcements (e.g. Yearbook and Class Supply List Details)
- Graduate and Alumni Events (e.g. Organizing Class Reunions)
Navigation
Can't Find What You Are Looking For?
Rankings
Nearby Cities
Sponsored Links
K-12 Articles
Bullycide: What is It and How Can It Be Prevented?
Disclaimer: This article expresses my opinion that has been formed by personal experience and...
Transform Your Middle School Slacker into a Scholar
All children need motivation to learn. Have your child's grades decreased since he started middle...
Summer Safety Tips to Keep Kids Safe
It won't be long until kids run from the school, shrieking in delight because they're free for the...


(4 / 5) 

