Colony High School
Rating
Not Available
Not Available

4 out of 5 | 20 Reviews
Find Old Friends From Colony High School
Use the form below to search for alumni from Colony High School.
School Description
School Summary and Highlights
- Enrolls 2,285 high school students from grades 9-12
- Ranks 663rd out of 1,197 high schools in CA.
- 2010 Overall School AYP Met Status: No
Additional Contact Information
- Mailing Address: 3850 East Riverside Dr., Ontario, CA 91761
School District Details
- Chaffey Joint Union High School District
- Per-Pupil Spending: $8,140
- Dropout Rate: 3.2%
- Students Per Teacher: 25.9
- Enrolled Students: 25,367
Faculty Details and Student Enrollment
Students and Faculty
- Total Students Enrolled: 2,285
- Total Full Time "Equivalent" Teachers: 88.2
- Average Student-To-Teacher Ratio: 25.9
Students Gender Breakdown
- Males: 1,210 (53.0%)
- Females: 1,075 (47.0%)
Free Lunch Student Eligibility Breakdown
- Eligible for Reduced Lunch: 197 (8.6%)
- Eligible for Free Lunch: 870 (38.1%)
- Eligible for Either Reduced or Free Lunch: 1,067 (46.7%)
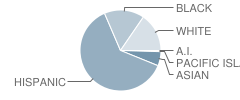
Student Enrollment Distribution by Race / Ethnicity
| Number | Percent | |
|---|---|---|
| American Indian | 7 | 0.3% |
| Black | 366 | 16.0% |
| Asian | 131 | 5.7% |
| Hispanic | 1,420 | 62.1% |
| White | 353 | 15.4% |
Number of Students Per Grade

| Number | Percent | |
|---|---|---|
| 9th Grade | 589 | 25.8% |
| 10th Grade | 633 | 27.7% |
| 11th Grade | 547 | 23.9% |
| 12th Grade | 516 | 22.6% |
Graduates Information (2010)
Graduation Rate
School:
86.1%
District:
82.2%
State:
78.6%
Teacher Education Background (2009)
Percent With Ph.D.
School:
2.8%
District:
8.3%
Percent With Master's Degree
School:
34.9%
District:
8.3%
Percent With Bachelor's Degree
School:
4.7%
District:
8.3%
Teacher Credentials & Experience (2009)
Percent of Teachers With Credentials: 98.9%
Number of Certificated Staff: 106.0
Average Number of Years of Teacher Experience: 12.1
Average Age
School:
40.1
District:
48.3
Source: CA Department of Education, Source: NCES 2009-2010
School Ratings and Reviews
Overall Rating: 4

4 out of 5 | 20 Reviews
The Overall Rating is the school's average rating from parents, students, school faculty and staff. The highest rating is five apples and the lowest is one apple.
Share Your Review About This School
20 reviews for Colony High School
- Reviewed by Student on February 08, 2011
- Rating:
 (5 / 5) Flag as inappropriate
 - This is a great school and so are the teachers there. Mr. Mollet is kind of strict but he is cool. The teachers just do their job and want us to succeed. Of course Mr. Rangel is the best Counselor you can ever look up to. :)Also, Mr. Moreno, Mrs. Higuera, Mrs. Fiandaca, and Mr. Miller are the bestest teachers there. Oh, Mr. San Angelo who unfortunately had to leave the school. :(.... Class of 2011!!!!! diana olvera
- Reviewed by Student on October 27, 2010
- Rating: (5 / 5) Flag as inappropriate
- The Best School I Have ever Seen
- Reviewed by Parent/Guardian on October 13, 2010
- Rating: (5 / 5) Flag as inappropriate
- I LOVE THE TEACHERS THERE. MR RANGEL IS THE BEST COUNSELOR THERE!
- Reviewed by Student on October 04, 2010
- Rating:
 (3 / 5) Flag as inappropriate
 - is a fun school, going back to school spirit!!
- Reviewed by Student on September 27, 2010
- Rating: (5 / 5) Flag as inappropriate
- This school has really great teachers! Ms. Whisler, Mrs. Chambers- Misawa , Mrs. Rodriguez, and Mr. Bishop all really care for there students.
- Reviewed by Student on September 27, 2010
- Rating: (5 / 5) Flag as inappropriate
- Mrs. Rodriguez is the best teacher ever! She is awesome. And Mrs. Wendt is a big old meanie head.
- Reviewed by Student on September 27, 2010
- Rating:
 (2 / 5) Flag as inappropriate
 - I lik3 C0lony H1gh Skuul. yeaaah boiiii.
- Reviewed by Student on September 14, 2010
- Rating: (5 / 5) Flag as inappropriate
- BEST SCHOOL EVER I ATTENDED COLONY FOR 3 YEARS UNTIL I HAD TO MOVE:( ITS THE BEST I RECOMEND IT :)
- Reviewed by Parent/Guardian on August 10, 2010
- Rating:
 (4 / 5) Flag as inappropriate
 - As with most schools.. Teachers will be good to those students who try to do their best. Colony H S has some great teachers and a couple of great counselors. The ELD and Fresman counselor for this year truly care about their students.
I have two daughters that went to this school. One of them didn't try very hard and always complained that teachers were mean, until she started applying herself and trying harder, then the teachers were much nicer, since they noticed she was trying to do better.
My other daughter is an outstanding student with a 4.5 GPA, and the honors and AP classes are not easy at all. She doesn't have complaints about her teachers at all.
- Reviewed by Student on August 08, 2010
- Rating: (5 / 5) Flag as inappropriate
- welll idk kn what to say about this school
- Reviewed by Parent/Guardian on July 21, 2010
- Rating: (5 / 5) Flag as inappropriate
- It is hard to say colony hs has great staff... i have had great teachers but there are adults i met in that school that were very unfair and a students voice is ignored among that school... and i do have to admit that math teacher really do suck in that school and its really not fair for us students... im so glad im finishing up my school year because that school brings me more sad memories than happy memories and its all personal cant say why sorry...
but we do have staff that do dirty things in that school and is a shame to be part of that district...
- Reviewed by Student on June 02, 2010
- Rating: (4 / 5) Flag as inappropriate
- I currently attend this school and yes it could be better but I can honestly say that its my home awway from home. Everyday I show up, and like most students,I am not looking forward to the initial start but once I get there I feel like I am around family.
- Reviewed by Parent/Guardian on May 22, 2010
- Rating: (5 / 5) Flag as inappropriate
- there are perhaps a small handful of teachers and counslers who care about all the students. But like in other posts unless you are in sports, drama, asb forget it. The majority of teachers make it difficult for the average student. 1/3 of my sons senior english class failed making them unable to graduate and take summer school while a economics teacher passed everyone regardless what their grade was in class he lied when it came time to turn in grades. How fair is this. The only bright spot was this years senior counsler she was marvelous to us and really cared.
- Reviewed by Parent/Guardian on May 11, 2010
- Rating:
 (1 / 5) Flag as inappropriate
 - I hated every moment that my daughter went to this school. I was glad we moved out of the area in her Senior year.
If your child is into organized sports, this is a great school. But the kids who don't or can't participate in sports (my daughter has a physical disability) try hard academically, but Colony doesn't emphasize academic achievements. The Math department is HORRIBLE. Last year a GREAT math teacher was recruited from Grace Yokley Middle School, but my daughter left that year and was never in his class.
Horrible school.
- Reviewed by Student on April 22, 2010
- Rating: (5 / 5) Flag as inappropriate
- I believe Colony is a great school. Of all the teachers I had in the past few years I've gotten along with all of them. There are very few teachers that are not good. The principal is great and welcoming. The school succeeds sports wise also. Students are challenged and many of my friends do well academically. I believe Colony is very good especially for being a newer school.
- Reviewed by Student on April 09, 2010
- Rating: (4 / 5) Flag as inappropriate
- The renaissance department sucks, I can tell you that. Each individual student has to independently raise $200 for each semester and that is counting for 10% of their grade! The teacher claims that it goes towards Renaissance, yet there is no actual proof it does and by the way ASB does not have to do that. That is just wrong.
- Reviewed by Student on February 18, 2010
- Rating: (5 / 5) Flag as inappropriate
- good school. horrible renaissance advisor. asb n renaissance r about helpin student n encouragin then n helpin them lik school. not bout popularity n hopin the teachers will lik u did this instead of that. both r full of drama n kids literly gettin EASY A's
- Reviewed by Parent/Guardian on January 21, 2010
- Rating: (5 / 5) Flag as inappropriate
- Hello Dear Parents:
I just need to know if anyone else has had a heck of time receiving accomodations for their child. If so, please share your experience with me.
Thank you.
- Reviewed by Staff Member on January 09, 2010
- Rating: (1 / 5) Flag as inappropriate
- horrible school
- Reviewed by Student on August 20, 2007
- Rating: (5 / 5) Flag as inappropriate
- This school has the best teachers a student can ask for. Colony has great school supplies and a great library. The campus is beautiful and over all the Colony is an excellent place to learn. I makes me happy to know I attended Colony High.
Read All 20 Reviews ->
School Map and Similar Schools Nearby
Click to Activate Map of Nearby School Campuses
Private
Public
This School
Similar Schools Nearby
| Jurupa Valley High School 9-12 | 2,034 Students | 3.3 miles away | Not Yet Rated | |
| Woodcrest Junior High School 7-8 | 508 Students | 4.2 miles away |  5 out of 5 | |
| Magnolia Junior High School 7-8 | 920 Students | 5.6 miles away | 5 out of 5 | |
| Ontario High School 9-12 | 2,943 Students | 5.8 miles away | 5 out of 5 | |
| Chaffey High School 9-12 | 3,645 Students | 6.4 miles away | Not Yet Rated | |
| Chino High School 9-12 | 2,767 Students | 6.7 miles away | Not Yet Rated | |
| Alta Loma High School 9-12 | 2,662 Students | 7.6 miles away | Not Yet Rated | |
| Chino Hills High School 9-12 | 2,927 Students | 7.7 miles away | 5 out of 5 | |
| Ramona Junior High School 7-8 | 887 Students | 7.8 miles away |  4.5 out of 5 | |
| Upland High School 9-12 | 3,709 Students | 8.0 miles away | 5 out of 5 | |
Compare This School To Nearby Schools ->
School Community Forum

Join a discussion about Colony High School and talk to others in the community including students, parents, teachers, and administrators.
Popular Discussion Topics
- Admissions and Registration Questions (e.g. Dress Code and Discipline Policy)
- School Calendar and Upcoming Events (e.g. Graduation)
- After School Programs, Extracurricular Activities, and Athletics (e.g. Football)
- News and Announcements (e.g. Yearbook and Class Supply List Details)
- Graduate and Alumni Events (e.g. Organizing Class Reunions)
Navigation
Can't Find What You Are Looking For?
Rankings
Nearby Cities
Sponsored Links
K-12 Articles

Parent and Family Involvement in School
When visiting my grandson's school, I often hear administrators and teachers complaining that not...
When visiting my grandson's school, I often hear administrators and teachers complaining that not...

Educators and Childhood Obesity
Obesity in childhood is rising to epidemic proportions in America and educators should be...
Obesity in childhood is rising to epidemic proportions in America and educators should be...

Teaching Children Respect
Statistics prove that there are many different family types in today's society. Grandparents or a...
Statistics prove that there are many different family types in today's society. Grandparents or a...