Shadyside High School
Rating
Not Available
Not Available

2.5 out of 5 | 5 Reviews
Find Old Friends From Shadyside High School
Use the form below to search for alumni from Shadyside High School.
School Description
School Summary and Highlights
- Enrolls 363 middle and high school students from grades 7-12
- Ranks 609th out of 812 high schools in OH.
Additional Contact Information
- Principal or Admin: Lawrence P. Falbo
- Fax: (740) 676-6616
School District Details
- Shadyside Local School District
- Per-Pupil Spending: $7,600
- Graduation Rate: 82.5%
- Dropout Rate: 1.6%
- Students Per Teacher: 17.0
- Enrolled Students: 852
Faculty Details and Student Enrollment
Students and Faculty
- Total Students Enrolled: 363
- Total Full Time "Equivalent" Teachers: 24.2
- Average Student-To-Teacher Ratio: 15.0
Students Gender Breakdown
- Males: 172 (47.4%)
- Females: 190 (52.3%)
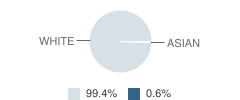
Student Enrollment Distribution by Race / Ethnicity
| Number | Percent | |
|---|---|---|
| American Indian | - | - |
| Black | - | - |
| Asian | 2 | 0.6% |
| Hispanic | - | - |
| White | 360 | 99.2% |
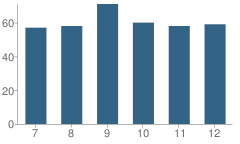
Number of Students Per Grade
| Number | Percent | |
|---|---|---|
| 7th Grade | 57 | 15.7% |
| 8th Grade | 58 | 16.0% |
| 9th Grade | 71 | 19.6% |
| 10th Grade | 60 | 16.5% |
| 11th Grade | 58 | 16.0% |
| 12th Grade | 59 | 16.3% |
Graduate Information (2009)
Graduation Rate
School:
92.2%
District:
92.2%
Graduating With Honors
School:
13.6%
District:
13.6%
Graduates Taking ACT
School:
57.6%
District:
57.6%
Teacher Credentials & Experience (2010)
Percent of Teachers That Have at Least a Master's Degree
School:
67.0%
District:
56.8%
Percent of Teachers That Have at Least a Bachelor's Degree
School:
100.0%
District:
100.0%
Percent of Teachers That Are Properly Certified
School:
100.0%
District:
100.0%
Average Years of Teacher Experience
School:
17.0
District:
17.0
Average Teacher Salary
School:
$48,848
District:
$47,655
Source: OH Department of Education, Source: NCES 2009-2010
School Ratings and Reviews
Overall Rating: 2.5

2.5 out of 5 | 5 Reviews
The Overall Rating is the school's average rating from parents, students, school faculty and staff. The highest rating is five apples and the lowest is one apple.
Share Your Review About This School
5 reviews for Shadyside High School
- Reviewed by Parent/Guardian on September 10, 2009
- Rating:
 (1 / 5) Flag as inappropriate
 - I believe the good reviews reflect the way Shadyside Schools were in the past. The present school system is very poor. The grades are inflated and the kids fall through the cracks when they graduate.
- Reviewed by Former Student on February 24, 2009
- Rating:
 (5 / 5) Flag as inappropriate
 - I graduated from SHS in 1986. I absolutley ADORE this school. My biggest regret is moving away from the area due to my job therefore having to place my child in another school. Her current school cannot hold a candle to Shadyside.I am very proud to have graduated from SHS and thankful for everything I learned while there and the experiences I had.
- Reviewed by Student on February 18, 2009
- Rating: (1 / 5) Flag as inappropriate
- The school has a lot of drama
- Reviewed by Student on February 10, 2009
- Rating: (1 / 5) Flag as inappropriate
- i hate this school i really do. every one in this school is rude and hateful the students in this school walk all over the teachers but until i leave this school im going to do whatever it takes to make it through the halls.
- Reviewed by Former Student on September 20, 2007
- Rating: (5 / 5) Flag as inappropriate
- I could not have had a better High School education anywhere! I look back now, following 35 years in education and retiring as Principal of the largest high school in San Diego CA in 1983, with great pride on Shadyside High and am so grateful and thankful for the opportunity given to me.
School Map and Similar Schools Nearby
Click to Activate Map of Nearby School Campuses
Private
Public
This School
Similar Schools Nearby
| Bellaire High School 9-12 | 381 Students | 3.2 miles away | Not Yet Rated | |
| Bridgeport High School 9-12 | 238 Students | 6.9 miles away |  5 out of 5 | |
| Martins Ferry High School 9-12 | 457 Students | 8.9 miles away | Not Yet Rated | |
| St Clairsville High School 9-12 | 552 Students | 11.1 miles away | Not Yet Rated | |
| Buckeye Local High School 9-12 | 643 Students | 15.2 miles away | Not Yet Rated | |
| Union Local High School 9-12 | 459 Students | 17.5 miles away | Not Yet Rated | |
| Beallsville High School 7-12 | 195 Students | 17.6 miles away |  1 out of 5 | |
Compare This School To Nearby Schools ->
School Community Forum

Join a discussion about Shadyside High School and talk to others in the community including students, parents, teachers, and administrators.
Popular Discussion Topics
- Admissions and Registration Questions (e.g. Dress Code and Discipline Policy)
- School Calendar and Upcoming Events (e.g. Graduation)
- After School Programs, Extracurricular Activities, and Athletics (e.g. Football)
- News and Announcements (e.g. Yearbook and Class Supply List Details)
- Graduate and Alumni Events (e.g. Organizing Class Reunions)
Navigation
Can't Find What You Are Looking For?
Nearby Cities
Sponsored Links
K-12 Articles

Feeling Good in Your Own Skin
Body image is a very touchy issue with today's kids. Since the 1950s, when Barbie was first...
Body image is a very touchy issue with today's kids. Since the 1950s, when Barbie was first...

School Lunches ... Hot or Cold?
First there were four, now there are six, no one knows how many more there may be in the future....
First there were four, now there are six, no one knows how many more there may be in the future....

What to Do when Your Child Hates School
All kids grumble about going to school at one time or another. This is perfectly normal, but what...
All kids grumble about going to school at one time or another. This is perfectly normal, but what...