Clark Intermediate School
Rating
Not Available
Not Available

5 out of 5 | 1 Review
Find Old Friends From Clark Intermediate School
Use the form below to search for alumni from Clark Intermediate School.
School Description
School Summary and Highlights
- Enrolls 1,444 middle school students from grades 7-8
- Ranks 804th out of 2,050 middle schools in CA.
- 2010 Overall School AYP Met Status: No
Additional Contact Information
- Mailing Address: 902 Fifth St., Clovis, CA 93612
School District Details
- Clovis Unified School District
- Per-Pupil Spending: $8,840
- Graduation Rate: 79.4%
- Dropout Rate: 2.1%
- Students Per Teacher: 22.7
- Enrolled Students: 38,002
Faculty Details and Student Enrollment
Students and Faculty
- Total Students Enrolled: 1,444
- Total Full Time "Equivalent" Teachers: 58.0
- Average Student-To-Teacher Ratio: 24.9
Students Gender Breakdown
- Males: 695 (48.1%)
- Females: 749 (51.9%)
Free Lunch Student Eligibility Breakdown
- Eligible for Reduced Lunch: 138 (9.6%)
- Eligible for Free Lunch: 483 (33.4%)
- Eligible for Either Reduced or Free Lunch: 621 (43.0%)
Student Enrollment Distribution by Race / Ethnicity
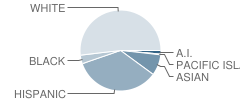
| Number | Percent | |
|---|---|---|
| American Indian | 22 | 1.5% |
| Black | 50 | 3.5% |
| Asian | 119 | 8.2% |
| Hispanic | 488 | 33.8% |
| White | 730 | 50.6% |
Number of Students Per Grade
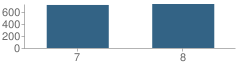
| Number | Percent | |
|---|---|---|
| 7th Grade | 714 | 49.4% |
| 8th Grade | 730 | 50.6% |
Teacher Education Background (2009)
Percent With Master's Degree
School:
33.3%
District:
57.3%
Percent With Bachelor's Degree
School:
66.7%
District:
32.6%
Teacher Credentials & Experience (2009)
Percent of Teachers With Emergency Credentials: 3.3%
Percent of Teachers With Credentials: 100.0%
Number of Certificated Staff: 66.0
Average Number of Years of Teacher Experience: 16.0
Average Age
School:
43.4
District:
43.5
Source: CA Department of Education, Source: NCES 2009-2010
School Ratings and Reviews
Overall Rating: 5

5 out of 5 | 1 Review
The Overall Rating is the school's average rating from parents, students, school faculty and staff. The highest rating is five apples and the lowest is one apple.
Share Your Review About This School
1 review for Clark Intermediate School
- Reviewed by Former Student on January 23, 2008
- Rating:
 (5 / 5) Flag as inappropriate
 - very awesome school
School Map and Similar Schools Nearby
Click to Activate Map of Nearby School Campuses
Private
Public
This School
Similar Schools Nearby
| Weldon Elementary School KG-6 | 626 Students | 0.5 miles away |  5 out of 5 | |
| Sierra Vista Elementary School KG-6 | 454 Students | 0.6 miles away |  4.5 out of 5 | |
| Century Elementary School KG-6 | 738 Students | 1.2 miles away | 5 out of 5 | |
| Jefferson Elementary School KG-6 | 554 Students | 1.3 miles away | Not Yet Rated | |
| Cox Elementary School KG-6 | 576 Students | 1.4 miles away | Not Yet Rated | |
| Clovis Elementary School KG-6 | 627 Students | 1.4 miles away | Not Yet Rated | |
| Cole Elementary School KG-6 | 778 Students | 1.4 miles away | Not Yet Rated | |
| Tarpey Elementary School KG-6 | 698 Students | 1.7 miles away | Not Yet Rated | |
| Gettysburg Elementary School KG-6 | 693 Students | 1.9 miles away | Not Yet Rated | |
| Cedarwood Elementary School KG-6 | 657 Students | 2.1 miles away | Not Yet Rated | |
Compare This School To Nearby Schools ->
School Community Forum

Join a discussion about Clark Intermediate School and talk to others in the community including students, parents, teachers, and administrators.
Popular Discussion Topics
- Admissions and Registration Questions (e.g. Dress Code and Discipline Policy)
- School Calendar and Upcoming Events (e.g. Graduation)
- After School Programs, Extracurricular Activities, and Athletics (e.g. Football)
- News and Announcements (e.g. Yearbook and Class Supply List Details)
- Graduate and Alumni Events (e.g. Organizing Class Reunions)
Navigation
Can't Find What You Are Looking For?
Rankings
Nearby Cities
Sponsored Links
K-12 Articles

Just a Harmless Vanilla Bean?
Some of the greatest, most used, and most profitable breakthroughs in science have not been made by...
Some of the greatest, most used, and most profitable breakthroughs in science have not been made by...

Breakfast, Kids and Learning
For generations parents have been telling their kids that breakfast is the most important meal of...
For generations parents have been telling their kids that breakfast is the most important meal of...

Asperger Syndrome: A Developmental Disorder on the Autism Spectrum
Asperger Syndrome, also known as Pervasive Developmental Disorder is on the high functioning end of...
Asperger Syndrome, also known as Pervasive Developmental Disorder is on the high functioning end of...