Coachella Valley High School

No Reviews Yet
Find Old Friends From Coachella Valley High School
Use the form below to search for alumni from Coachella Valley High School.
School Description
School Summary and Highlights
- Enrolls 2,786 high school students from grades 9-12
- Ranks 964th out of 1,197 high schools in CA.
- 2010 Overall School AYP Met Status: No
Additional Contact Information
- Mailing Address: 83-800 Airport Blvd., Thermal, CA 92274
School Operational Details
- Title I EligibleAll students of this school are eligible for participation in authorized programs.
School District Details
- Coachella Valley Unified School District
- Per-Pupil Spending: $9,952
- Graduation Rate: 68.0%
- Dropout Rate: 5.7%
- Students Per Teacher: 19.9
- Enrolled Students: 18,186
Faculty Details and Student Enrollment
Students and Faculty
- Total Students Enrolled: 2,786
- Total Full Time "Equivalent" Teachers: 125.0
- Average Student-To-Teacher Ratio: 22.3
Students Gender Breakdown
- Males: 1,374 (49.3%)
- Females: 1,412 (50.7%)
Free Lunch Student Eligibility Breakdown
- Eligible for Reduced Lunch: 354 (12.7%)
- Eligible for Free Lunch: 1,754 (63.0%)
- Eligible for Either Reduced or Free Lunch: 2,108 (75.7%)
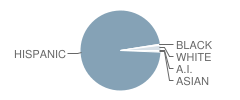
Student Enrollment Distribution by Race / Ethnicity

| Number | Percent | |
|---|---|---|
| American Indian | 8 | 0.3% |
| Black | 12 | 0.4% |
| Asian | 10 | 0.4% |
| Hispanic | 2,684 | 96.3% |
| White | 58 | 2.1% |
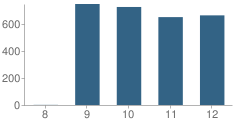
Number of Students Per Grade

| Number | Percent | |
|---|---|---|
| 8th Grade | 1 | 0.04% |
| 9th Grade | 747 | 26.8% |
| 10th Grade | 725 | 26.0% |
| 11th Grade | 650 | 23.3% |
| 12th Grade | 663 | 23.8% |
Graduates Information (2010)
Graduation Rate
School:
73.1%
District:
70.2%
State:
78.6%
Teacher Education Background (2009)
Percent With Ph.D.
School:
2.8%
District:
3.2%
Percent With Master's Degree
School:
16.7%
District:
38.7%
Percent With Bachelor's Degree
School:
22.9%
District:
9.7%
Teacher Credentials & Experience (2009)
Percent of Teachers With Emergency Credentials: 2.4%
Percent of Teachers With Credentials: 82.4%
Number of Certificated Staff: 144.0
Average Number of Years of Teacher Experience: 13.1
Average Age
School:
45.6
District:
46.8
Source: CA Department of Education, Source: NCES 2009-2010
School Ratings and Reviews
Be The First To Review Coachella Valley High School!
Sponsored Links
Test Scores and Performance Information
Overall School Rating
How is this determined?
The overall school rating shows that Coachella Valley High School performed on average worse than many other schools across the state on CST state exams in the following subjects:
- CST Algebra I
- CST Algebra II
- CST Biology
- CST Chemistry
- CST Earth Science
- CST English-Language Arts
- CST General Mathematics
- CST Geometry
- CST Physics
- CST Science
- CST Summative High School Math
- CST U.S. History
- CST World History
AYP Results (2010)
Overall AYP Met: No
ELA AYP Met: No
Math AYP Met: No
Program Improvement (PI) Requirement Under NCLB (2010)
First Year PI Requirement was Implemented: 2003-2004
School's Placement Under NCLB: Year 5
ACT Exam Results (2009)
Percent of Students Taking ACT Exam: 29.1%
Average Combined Score: 17.1
Percent Scoring At or Above 21: 13.8%
SAT Exam Results (2009)
Percent of Students Taking SAT Exam: 27.4%
Average Combined Score: 1,244.5
Critical Reading Average: 411.2
Math Average: 417.7
Writing Average: 415.6
Percent Scoring At or Above 1500: 10.0%
CST - Test Proficiency by Grade and Subject
Grade 9 - % of students at or above proficiency
| School | District | State | |
|---|---|---|---|
| CST Algebra I Test | |||
| 2010 | 14.0% | 12.0% | 22.0% |
| 2009 | 11.0% | 12.0% | 21.0% |
| 2008 | 10.0% | 8.0% | 18.0% |
| CST Biology Test | |||
| 2010 | 35.0% | 34.0% | 55.0% |
| 2009 | 39.0% | 40.0% | 51.0% |
| 2008 | 47.0% | 38.0% | 52.0% |
| CST Earth Science Test | |||
| 2010 | 14.0% | 15.0% | 35.0% |
| 2009 | 6.0% | 5.0% | 29.0% |
| 2008 | 9.0% | 8.0% | 31.0% |
| CST English-Language Arts Test | |||
| 2010 | 35.0% | 34.0% | 54.0% |
| 2009 | 33.0% | 31.0% | 50.0% |
| 2008 | 31.0% | 29.0% | 49.0% |
| CST General Mathematics Test | |||
| 2010 | 3.0% | 3.0% | 17.0% |
| 2009 | 13.0% | 11.0% | 17.0% |
| 2008 | 9.0% | 11.0% | 18.0% |
| CST Geometry Test | |||
| 2010 | 68.0% | 34.0% | 46.0% |
| 2009 | 86.0% | 67.0% | 47.0% |
| 2008 | 86.0% | 62.0% | 43.0% |
Grade 10 - % of students at or above proficiency
| School | District | State | |
|---|---|---|---|
| CST Algebra I Test | |||
| 2010 | 3.0% | 3.0% | 12.0% |
| 2009 | 1.0% | 2.0% | 11.0% |
| 2008 | 4.0% | 3.0% | 9.0% |
| CST Algebra II Test | |||
| 2010 | 55.0% | 40.0% | 40.0% |
| 2009 | 50.0% | 22.0% | 37.0% |
| 2008 | 2.0% | 3.0% | 36.0% |
| CST Biology Test | |||
| 2010 | 15.0% | 15.0% | 38.0% |
| 2009 | 11.0% | 11.0% | 34.0% |
| 2008 | 10.0% | 11.0% | 35.0% |
| CST Chemistry Test | |||
| 2010 | 50.0% | 29.0% | 47.0% |
| 2009 | 13.0% | 13.0% | 44.0% |
| 2008 | 24.0% | 16.0% | 41.0% |
| CST Earth Science Test | |||
| 2010 | 15.0% | 12.0% | 29.0% |
| 2009 | 7.0% | 6.0% | 23.0% |
| 2008 | 12.0% | 10.0% | 23.0% |
| CST English-Language Arts Test | |||
| 2010 | 28.0% | 26.0% | 45.0% |
| 2009 | 26.0% | 22.0% | 44.0% |
| 2008 | 24.0% | 20.0% | 41.0% |
| CST Geometry Test | |||
| 2010 | 2.0% | 2.0% | 14.0% |
| 2009 | 7.0% | 5.0% | 14.0% |
| 2008 | 1.0% | 1.0% | 12.0% |
| CST Science Test | |||
| 2010 | 28.0% | 25.0% | 46.0% |
| 2009 | 17.0% | 18.0% | 44.0% |
| 2008 | 16.0% | 13.0% | 40.0% |
| CST World History Test | |||
| 2010 | 22.0% | 21.0% | 42.0% |
| 2009 | 12.0% | 11.0% | 38.0% |
| 2008 | 8.0% | 8.0% | 33.0% |
| CST Physics Test | |||
| 2009 | 78.0% | 75.0% | 40.0% |
| CST Summative High School Math Test | |||
| 2008 | 43.0% | 30.0% | 68.0% |
Grade 11 - % of students at or above proficiency
| School | District | State | |
|---|---|---|---|
| CST Algebra II Test | |||
| 2010 | 9.0% | 9.0% | 14.0% |
| 2009 | 1.0% | 1.0% | 12.0% |
| 2008 | 2.0% | 1.0% | 11.0% |
| CST Biology Test | |||
| 2010 | 22.0% | 20.0% | 46.0% |
| 2009 | 12.0% | 11.0% | 41.0% |
| 2008 | 14.0% | 11.0% | 39.0% |
| CST Chemistry Test | |||
| 2010 | 12.0% | 8.0% | 30.0% |
| 2009 | 12.0% | 8.0% | 27.0% |
| 2008 | 8.0% | 5.0% | 25.0% |
| CST English-Language Arts Test | |||
| 2010 | 24.0% | 23.0% | 42.0% |
| 2009 | 20.0% | 19.0% | 40.0% |
| 2008 | 16.0% | 14.0% | 37.0% |
| CST Geometry Test | |||
| 2010 | 1.0% | - | 6.0% |
| 2009 | 3.0% | 2.0% | 7.0% |
| 2008 | 2.0% | 2.0% | 6.0% |
| CST Physics Test | |||
| 2010 | 47.0% | 31.0% | 53.0% |
| CST Summative High School Math Test | |||
| 2010 | 52.0% | 24.0% | 50.0% |
| 2009 | 23.0% | 11.0% | 47.0% |
| 2008 | 8.0% | 6.0% | 43.0% |
| CST U.S. History Test | |||
| 2010 | 20.0% | 23.0% | 45.0% |
| 2009 | 26.0% | 25.0% | 44.0% |
| 2008 | 19.0% | 17.0% | 38.0% |
| CST World History Test | |||
| 2010 | 12.0% | 9.0% | 15.0% |
| CST Algebra I Test | |||
| 2009 | 1.0% | 1.0% | 8.0% |
| 2008 | 3.0% | 3.0% | 5.0% |
| CST Earth Science Test | |||
| 2009 | 13.0% | 11.0% | 26.0% |
| 2008 | 8.0% | 7.0% | 28.0% |
End of Course - % of students at or above proficiency
| School | District | State | |
|---|---|---|---|
| CST Algebra I Test | |||
| 2010 | 10.0% | 24.0% | 31.0% |
| 2009 | 6.0% | 16.0% | 28.0% |
| 2008 | 6.0% | 13.0% | 25.0% |
| CST Algebra II Test | |||
| 2010 | 24.0% | 22.0% | 31.0% |
| 2009 | 20.0% | 12.0% | 28.0% |
| 2008 | 2.0% | 3.0% | 27.0% |
| CST Biology Test | |||
| 2010 | 25.0% | 24.0% | 46.0% |
| 2009 | 21.0% | 22.0% | 42.0% |
| 2008 | 21.0% | 19.0% | 42.0% |
| CST Chemistry Test | |||
| 2010 | 30.0% | 17.0% | 38.0% |
| 2009 | 12.0% | 9.0% | 36.0% |
| 2008 | 13.0% | 10.0% | 32.0% |
| CST Earth Science Test | |||
| 2010 | 13.0% | 14.0% | 33.0% |
| 2009 | 8.0% | 7.0% | 28.0% |
| 2008 | 10.0% | 8.0% | 28.0% |
| CST General Mathematics Test | |||
| 2010 | 3.0% | 7.0% | 27.0% |
| 2009 | 13.0% | 21.0% | 26.0% |
| 2008 | 9.0% | 16.0% | 27.0% |
| CST Geometry Test | |||
| 2010 | 17.0% | 11.0% | 27.0% |
| 2009 | 22.0% | 17.0% | 26.0% |
| 2008 | 24.0% | 14.0% | 24.0% |
| CST Physics Test | |||
| 2010 | 43.0% | 30.0% | 49.0% |
| 2009 | 79.0% | 31.0% | 46.0% |
| CST Summative High School Math Test | |||
| 2010 | 52.0% | 23.0% | 54.0% |
| 2009 | 21.0% | 12.0% | 50.0% |
| 2008 | 19.0% | 12.0% | 47.0% |
| CST World History Test | |||
| 2010 | 21.0% | 20.0% | 41.0% |
| 2009 | 11.0% | 11.0% | 38.0% |
| 2008 | 7.0% | 8.0% | 33.0% |
Source: CA Department of Education 2009-2010
School Map and Similar Schools Nearby
Click to Activate Map of Nearby School Campuses
Private
Public
This School
Similar Schools Nearby
| Indio High School 9-12 | 2,447 Students | 5.4 miles away | Not Yet Rated | |
| Desert Mirage High School 9-12 | 1,881 Students | 5.5 miles away | ![]() 5 out of 5 | |
| Shadow Hills High School 9-12 | 640 Students | 6.9 miles away | Not Yet Rated | - |
| La Quinta High School 9-12 | 2,985 Students | 6.9 miles away | Not Yet Rated | |
| Palm Desert High School 9-12 | 2,103 Students | 11.0 miles away | Not Yet Rated | |
| Cathedral City High School 9-12 | 2,849 Students | 18.2 miles away | Not Yet Rated | |
| Palm Springs High School 9-12 | 2,158 Students | 21.9 miles away | Not Yet Rated | |
| Hamilton High School 9-12 | 393 Students | 26.8 miles away | Not Yet Rated | |
| West Shores High School 7-12 | 396 Students | 27.5 miles away | ![]() 2 out of 5 | |
| Borrego Springs High School 9-12 | 150 Students | 28.0 miles away | Not Yet Rated | |
Compare This School To Nearby Schools ->
School Community Forum

Join a discussion about Coachella Valley High School and talk to others in the community including students, parents, teachers, and administrators.
Popular Discussion Topics
- Admissions and Registration Questions (e.g. Dress Code and Discipline Policy)
- School Calendar and Upcoming Events (e.g. Graduation)
- After School Programs, Extracurricular Activities, and Athletics (e.g. Football)
- News and Announcements (e.g. Yearbook and Class Supply List Details)
- Graduate and Alumni Events (e.g. Organizing Class Reunions)
Navigation
Can't Find What You Are Looking For?
Rankings
Nearby Cities
Sponsored Links
K-12 Articles
Transform Your Middle School Slacker into a Scholar
All children need motivation to learn. Have your child's grades decreased since he started middle...
Teaching Children Respect
Statistics prove that there are many different family types in today's society. Grandparents or a...
Keep Your Licensed Teen Safe This Summer
Every year hundreds of teenage drivers lose their lives in motor vehicle accidents. Statistics show...


