Lowellville High School
Rating
Not Available
Not Available

5 out of 5 | 1 Review
Find Old Friends From Lowellville High School
Use the form below to search for alumni from Lowellville High School.
School Description
School Summary and Highlights
- Enrolls 321 middle and high school students from grades 7-12
- Ranks 19th out of 812 high schools in OH.
Additional Contact Information
- Principal or Admin: Rocco Nero
- Fax: (330) 536-8468
School District Details
- Lowellville Local School District
- Per-Pupil Spending: $7,371
- Graduation Rate: 92.7%
- Students Per Teacher: 14.6
- Enrolled Students: 604
Faculty Details and Student Enrollment
Students and Faculty
- Total Students Enrolled: 321
- Total Full Time "Equivalent" Teachers: 25.7
- Average Student-To-Teacher Ratio: 12.5
Students Gender Breakdown
- Males: 155 (48.3%)
- Females: 163 (50.8%)
Free Lunch Student Eligibility Breakdown
- Eligible for Reduced Lunch: 73 (22.7%)
- Eligible for Free Lunch: 131 (40.8%)
- Eligible for Either Reduced or Free Lunch: 204 (63.6%)
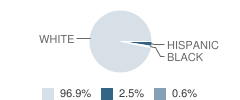
Student Enrollment Distribution by Race / Ethnicity
| Number | Percent | |
|---|---|---|
| American Indian | - | - |
| Black | 2 | 0.6% |
| Asian | - | - |
| Hispanic | 8 | 2.5% |
| White | 308 | 96.0% |
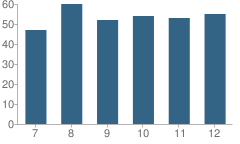
Number of Students Per Grade
| Number | Percent | |
|---|---|---|
| 7th Grade | 47 | 14.6% |
| 8th Grade | 60 | 18.7% |
| 9th Grade | 52 | 16.2% |
| 10th Grade | 54 | 16.8% |
| 11th Grade | 53 | 16.5% |
| 12th Grade | 55 | 17.1% |
Graduate Information (2009)
Graduation Rate
School:
100.0%
District:
100.0%
Graduating With Honors
School:
25.0%
District:
25.0%
Graduates Taking ACT
School:
78.8%
District:
78.8%
Graduates Taking SAT
School:
7.7%
District:
7.7%
Teacher Credentials & Experience (2010)
Percent of Teachers That Have at Least a Master's Degree
School:
25.3%
District:
20.9%
Percent of Teachers That Have at Least a Bachelor's Degree
School:
100.0%
District:
100.0%
Percent of Teachers That Are Properly Certified
School:
96.8%
District:
97.9%
Average Years of Teacher Experience
School:
14.0
District:
13.0
Average Teacher Salary
School:
$37,786
District:
$45,200
Source: OH Department of Education, Source: NCES 2009-2010
School Ratings and Reviews
Overall Rating: 5

5 out of 5 | 1 Review
The Overall Rating is the school's average rating from parents, students, school faculty and staff. The highest rating is five apples and the lowest is one apple.
Share Your Review About This School
1 review for Lowellville High School
- Reviewed by Student on May 14, 2009
- Rating:
 (5 / 5) Flag as inappropriate
 - awesome school for kids they learn wat they need to and 5th grade goes to camp fitch
School Map and Similar Schools Nearby
Click to Activate Map of Nearby School Campuses
Private
Public
This School
Similar Schools Nearby
| Struthers High School 9-12 | 660 Students | 2.5 miles away |  1 out of 5 | |
| Struthers Middle School 5-9 | 626 Students | 2.7 miles away |  3.5 out of 5 | |
| Poland Seminary High School 9-12 | 806 Students | 3.4 miles away | Not Yet Rated | |
| Memorial High School 9-12 | 397 Students | 3.5 miles away |  2 out of 5 | |
| Rayen High School 9-12 | 973 Students | 5.4 miles away | Not Yet Rated | |
| Springfield High School 9-12 | 352 Students | 6.2 miles away |  5 out of 5 | |
| Novanet High School 6-12 | 66 Students | 6.4 miles away | Not Yet Rated | - |
| Odyssey: School of Possibilities 3-12 | 100 Students | 6.5 miles away | Not Yet Rated | |
| Boardman High School 9-12 | 1,543 Students | 6.7 miles away | Not Yet Rated | |
| Hubbard High School 9-12 | 710 Students | 7.6 miles away | Not Yet Rated | |
Compare This School To Nearby Schools ->
School Community Forum

Join a discussion about Lowellville High School and talk to others in the community including students, parents, teachers, and administrators.
Popular Discussion Topics
- Admissions and Registration Questions (e.g. Dress Code and Discipline Policy)
- School Calendar and Upcoming Events (e.g. Graduation)
- After School Programs, Extracurricular Activities, and Athletics (e.g. Football)
- News and Announcements (e.g. Yearbook and Class Supply List Details)
- Graduate and Alumni Events (e.g. Organizing Class Reunions)
Navigation
Can't Find What You Are Looking For?
Nearby Cities
Sponsored Links
K-12 Articles

Exciting School Lunch Ideas
Earlier this week I had reason to drop by my grandsons' school at lunch time. While waiting for the...
Earlier this week I had reason to drop by my grandsons' school at lunch time. While waiting for the...

Bullycide: What is It and How Can It Be Prevented?
Disclaimer: This article expresses my opinion that has been formed by personal experience and...
Disclaimer: This article expresses my opinion that has been formed by personal experience and...

Asperger Syndrome: A Developmental Disorder on the Autism Spectrum
Asperger Syndrome, also known as Pervasive Developmental Disorder is on the high functioning end of...
Asperger Syndrome, also known as Pervasive Developmental Disorder is on the high functioning end of...