Antwerp Local High School
Rating
Not Available
Not Available

No Reviews Yet
Find Old Friends From Antwerp Local High School
Use the form below to search for alumni from Antwerp Local High School.
School Description
School Summary and Highlights
- Enrolls 215 high school students from grades 9-12
- Ranks 35th out of 812 high schools in OH.
Additional Contact Information
- Mailing Address: 303 S. Harrmann Rd, Antwerp, OH 45813
- Principal or Admin: Stephen E. Arnold
- Fax: (419) 258-4041
School District Details
- Antwerp Local School District
- Per-Pupil Spending: $8,252
- Graduation Rate: 94.2%
- Students Per Teacher: 16.7
- Enrolled Students: 667
Faculty Details and Student Enrollment
Students and Faculty
- Total Students Enrolled: 215
- Total Full Time "Equivalent" Teachers: 22.0
- Average Student-To-Teacher Ratio: 9.8
Students Gender Breakdown
- Males: 111 (51.6%)
- Females: 103 (47.9%)
Free Lunch Student Eligibility Breakdown
- Eligible for Reduced Lunch: 60 (27.9%)
- Eligible for Free Lunch: 142 (66.0%)
- Eligible for Either Reduced or Free Lunch: 202 (94.0%)
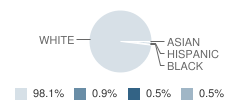
Student Enrollment Distribution by Race / Ethnicity
| Number | Percent | |
|---|---|---|
| American Indian | - | - |
| Black | 1 | 0.5% |
| Asian | 1 | 0.5% |
| Hispanic | 2 | 0.9% |
| White | 210 | 97.7% |
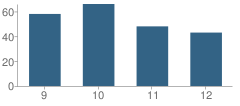
Number of Students Per Grade
| Number | Percent | |
|---|---|---|
| 9th Grade | 58 | 27.0% |
| 10th Grade | 66 | 30.7% |
| 11th Grade | 48 | 22.3% |
| 12th Grade | 43 | 20.0% |
Graduate Information (2009)
Graduation Rate
School:
94.0%
District:
94.0%
Graduating With Honors
School:
17.0%
District:
17.0%
Graduates Taking ACT
School:
63.8%
District:
63.8%
Graduates Taking SAT
School:
4.3%
District:
4.3%
Teacher Credentials & Experience (2010)
Percent of Teachers That Have at Least a Master's Degree
School:
50.0%
District:
62.9%
Percent of Teachers That Have at Least a Bachelor's Degree
School:
100.0%
District:
100.0%
Percent of Teachers That Are Properly Certified
School:
98.5%
District:
97.1%
Average Years of Teacher Experience
School:
13.0
District:
14.0
Average Teacher Salary
School:
$41,675
District:
$45,816
Source: OH Department of Education, Source: NCES 2009-2010
School Ratings and Reviews
Be The First To Review Antwerp Local High School!
School Map and Similar Schools Nearby
Click to Activate Map of Nearby School Campuses
Private
Public
This School
Similar Schools Nearby
| Paulding High School 9-12 | 407 Students | 8.4 miles away | Not Yet Rated | |
| Wayne Trace High School 7-12 | 445 Students | 12.5 miles away | Not Yet Rated | |
| Crestview High School 7-12 | 425 Students | 18.7 miles away | Not Yet Rated | |
| Van Wert High School 9-12 | 572 Students | 24.3 miles away | Not Yet Rated | |
| Continental Local High School 9-12 | 142 Students | 24.6 miles away | Not Yet Rated | |
| Lincolnview High School (Junior / Senior) 7-12 | 361 Students | 25.6 miles away |  4 out of 5 | |
| Ottoville High School 7-12 | 247 Students | 26.8 miles away | Not Yet Rated | |
| Fort Jennings High School 7-12 | 194 Students | 29.3 miles away | Not Yet Rated | |
Compare This School To Nearby Schools ->
School Community Forum

Join a discussion about Antwerp Local High School and talk to others in the community including students, parents, teachers, and administrators.
Popular Discussion Topics
- Admissions and Registration Questions (e.g. Dress Code and Discipline Policy)
- School Calendar and Upcoming Events (e.g. Graduation)
- After School Programs, Extracurricular Activities, and Athletics (e.g. Football)
- News and Announcements (e.g. Yearbook and Class Supply List Details)
- Graduate and Alumni Events (e.g. Organizing Class Reunions)
Navigation
Can't Find What You Are Looking For?
Nearby Cities
Sponsored Links
K-12 Articles

Preparing Your Child for the First Day of School
It seems like school was just dismissed for the summer, yet here we are facing another year of back...
It seems like school was just dismissed for the summer, yet here we are facing another year of back...

Grammar...not Just Extended Family Anymore!
Can I talk to y'all abit about grammar? Right grammar and punctuations got to be some of the...
Can I talk to y'all abit about grammar? Right grammar and punctuations got to be some of the...

Where in the World is Carmen Sandiego?
One of the sensations on YouTube highlights the state of our education system. The spot was...
One of the sensations on YouTube highlights the state of our education system. The spot was...