Leipsic High School
Rating
Not Available
Not Available

No Reviews Yet
Find Old Friends From Leipsic High School
Use the form below to search for alumni from Leipsic High School.
School Description
School Summary and Highlights
- Enrolls 320 middle and high school students from grades 7-12
- Ranks 52nd out of 812 high schools in OH.
Additional Contact Information
- Principal or Admin: Michael L. Bute
- Fax: (419) 943-2185
School District Details
- Leipsic Local School District
- Per-Pupil Spending: $8,267
- Graduation Rate: 94.2%
- Dropout Rate: 3.3%
- Students Per Teacher: 14.6
- Enrolled Students: 634
Faculty Details and Student Enrollment
Students and Faculty
- Total Students Enrolled: 320
- Total Full Time "Equivalent" Teachers: 23.0
- Average Student-To-Teacher Ratio: 13.9
Students Gender Breakdown
- Males: 144 (45.0%)
- Females: 139 (43.4%)
Free Lunch Student Eligibility Breakdown
- Eligible for Reduced Lunch: 64 (20.0%)
- Eligible for Free Lunch: 253 (79.1%)
- Eligible for Either Reduced or Free Lunch: 317 (99.1%)
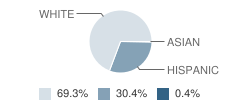
Student Enrollment Distribution by Race / Ethnicity
| Number | Percent | |
|---|---|---|
| American Indian | - | - |
| Black | - | - |
| Asian | 1 | 0.3% |
| Hispanic | 86 | 26.9% |
| White | 196 | 61.3% |
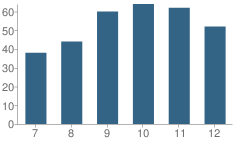
Number of Students Per Grade
| Number | Percent | |
|---|---|---|
| 7th Grade | 38 | 11.9% |
| 8th Grade | 44 | 13.8% |
| 9th Grade | 60 | 18.8% |
| 10th Grade | 64 | 20.0% |
| 11th Grade | 62 | 19.4% |
| 12th Grade | 52 | 16.3% |
Graduate Information (2009)
Graduation Rate
School:
89.2%
District:
89.2%
Graduating With Honors
School:
31.8%
District:
31.8%
Graduates Taking ACT
School:
71.2%
District:
71.2%
Teacher Credentials & Experience (2010)
Percent of Teachers That Have at Least a Master's Degree
School:
76.2%
District:
77.6%
Percent of Teachers That Have at Least a Bachelor's Degree
School:
100.0%
District:
100.0%
Percent of Teachers That Are Properly Certified
School:
100.0%
District:
100.0%
Average Years of Teacher Experience
School:
20.0
District:
25.0
Average Teacher Salary
School:
$49,221
District:
$48,984
Source: OH Department of Education, Source: NCES 2009-2010
School Ratings and Reviews
Be The First To Review Leipsic High School!
School Map and Similar Schools Nearby
Click to Activate Map of Nearby School Campuses
Private
Public
This School
Similar Schools Nearby
| Ottawa-Glandorf High School 9-12 | 592 Students | 5.7 miles away | Not Yet Rated | |
| Pandora-Gilboa High School 9-12 | 176 Students | 10.1 miles away | Not Yet Rated | |
| Mccomb Local High School 9-12 | 253 Students | 10.3 miles away | Not Yet Rated | |
| Columbus Grove High School 9-12 | 309 Students | 12.7 miles away | Not Yet Rated | |
| Kalida High School 6-12 | 355 Students | 13.5 miles away | Not Yet Rated | |
| Continental Local High School 9-12 | 142 Students | 14.4 miles away | Not Yet Rated | |
| Cory-Rawson High School 9-12 | 226 Students | 14.6 miles away | Not Yet Rated | |
| Bluffton High School 9-12 | 340 Students | 15.1 miles away | Not Yet Rated | |
| Liberty-Benton High School 9-12 | 424 Students | 15.8 miles away |  4 out of 5 | |
| North Baltimore High School 9-12 | 196 Students | 17.2 miles away | Not Yet Rated | |
Compare This School To Nearby Schools ->
School Community Forum

Join a discussion about Leipsic High School and talk to others in the community including students, parents, teachers, and administrators.
Popular Discussion Topics
- Admissions and Registration Questions (e.g. Dress Code and Discipline Policy)
- School Calendar and Upcoming Events (e.g. Graduation)
- After School Programs, Extracurricular Activities, and Athletics (e.g. Football)
- News and Announcements (e.g. Yearbook and Class Supply List Details)
- Graduate and Alumni Events (e.g. Organizing Class Reunions)
Navigation
Can't Find What You Are Looking For?
Nearby Cities
Sponsored Links
K-12 Articles

Information on Cyberbullying
What is Cyberbullying? Cyberbullying is a new form of harassment, emotional abuse,...
What is Cyberbullying? Cyberbullying is a new form of harassment, emotional abuse,...

Cut the Credit and Save You Some Money
Today’s society glorifies a get-it-now mentality. Children learn this early. You probably noticed...
Today’s society glorifies a get-it-now mentality. Children learn this early. You probably noticed...

Summer Safety Tips to Keep Kids Safe
It won’t be long until kids run from the school, shrieking in delight because they’re free for the...
It won’t be long until kids run from the school, shrieking in delight because they’re free for the...