Centennial High School
Rating
Not Available
Not Available

4 out of 5 | 19 Reviews
Find Old Friends From Centennial High School
Use the form below to search for alumni from Centennial High School.
School Description
School Summary and Highlights
- Enrolls 1,367 high school students from grades 9-12
- Ranks 1166th out of 1,197 high schools in CA.
- 2010 Overall School AYP Met Status: No
Additional Contact Information
- Mailing Address: 2606 North Central Ave., Compton, CA 90222
School Operational Details
- Title I EligibleAll students of this school are eligible for participation in authorized programs.
School District Details
- Compton Unified School District
- Per-Pupil Spending: $9,296
- Graduation Rate: 38.4%
- Dropout Rate: 12.8%
- Students Per Teacher: 18.8
- Enrolled Students: 26,531
Faculty Details and Student Enrollment
Students and Faculty
- Total Students Enrolled: 1,367
- Total Full Time "Equivalent" Teachers: 71.0
- Average Student-To-Teacher Ratio: 19.3
Students Gender Breakdown
- Males: 673 (49.2%)
- Females: 694 (50.8%)
Free Lunch Student Eligibility Breakdown
- Eligible for Reduced Lunch: 64 (4.7%)
- Eligible for Free Lunch: 699 (51.1%)
- Eligible for Either Reduced or Free Lunch: 763 (55.8%)
Student Enrollment Distribution by Race / Ethnicity
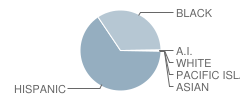
| Number | Percent | |
|---|---|---|
| American Indian | 2 | 0.1% |
| Black | 461 | 33.7% |
| Asian | 1 | 0.07% |
| Hispanic | 879 | 64.3% |
| White | 3 | 0.2% |
Number of Students Per Grade
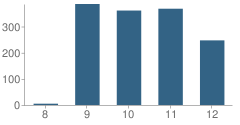
| Number | Percent | |
|---|---|---|
| 8th Grade | 5 | 0.4% |
| 9th Grade | 386 | 28.2% |
| 10th Grade | 361 | 26.4% |
| 11th Grade | 368 | 26.9% |
| 12th Grade | 247 | 18.1% |
Graduates Information (2010)
Graduation Rate
School:
46.2%
District:
47.3%
State:
78.6%
Teacher Education Background (2009)
Percent With Ph.D.
School:
6.2%
District:
13.5%
Percent With Master's Degree
School:
24.6%
District:
23.0%
Percent With Bachelor's Degree
School:
10.8%
District:
1.4%
Teacher Credentials & Experience (2009)
Percent of Teachers With Emergency Credentials: 1.9%
Percent of Teachers With Credentials: 92.6%
Number of Certificated Staff: 65.0
Average Number of Years of Teacher Experience: 11.4
Average Age
School:
40.8
District:
44.8
Source: CA Department of Education, Source: NCES 2009-2010
School Ratings and Reviews
Overall Rating: 4

4 out of 5 | 19 Reviews
The Overall Rating is the school's average rating from parents, students, school faculty and staff. The highest rating is five apples and the lowest is one apple.
Share Your Review About This School
19 reviews for Centennial High School
- Reviewed by Parent or Guardian on November 22, 2011
- Rating:
 (5 / 5) Flag as inappropriate
 - During my years at the Ten I must say I had a great time and learned a whole lot. I attended college and I'm doing well in life. what a great High School with lots of pride and spirit. GO BIG TEN!
- Reviewed by Former Student on December 09, 2010
- Rating:
 (2 / 5) Flag as inappropriate
 - I went to thee 10 and personally i thought, Why do people talk bad about this school and want to close it up? I was suppose to be with class 01' but my jr. year was destroyed by the attendance office,counselors and the damn computers. My sophomore year, grades were bad i attended summer school pass with A's & B's. Great!!! Is what i thought. YEAH RIGHT!!! When i return for sophomore year 1week of school they told me they couldn't find my summer school attendance. The computers lost all summer reports. And they wanted me to REPEAT because of their mistake. Of course i DROPED-OUT i know now that was a bad idea. But now i know why people talk bad about this screwed up school. If you attend Centennial keep up with all your paperwork cause trust me they NOT."AND THAT'S A FACT"
- Reviewed by Former Student on December 01, 2010
- Rating: (5 / 5) Flag as inappropriate
- Well, me personally when i went there it was cool but you just have to want to learn.It's not so much the teachers its the students. That goes for any school rather its Intermediate/Elementary, Jr./Middle School/High-School or College. As far as the fighting, gangs, drugs etc there has to be a little more stricter enforcement kids are growing up o fast theses days. It's not the teachers fault its he parents majority of the time. Parents should become more involved with their childs education life. If you feel like anything is an error within their child's education do something about it. Well, in conclusion, all my teachers were good I made sure I learned everyday I went if not there was no purpose for going.?In my opinion I would say stay on the counselors because they will screw you up. Gots Big Ten!
P.S. I need my transcripts from 2000-2004
- Reviewed by Student on September 09, 2010
- Rating:
 (4 / 5) Flag as inappropriate
 - well what can i say? centennial is the best school in compton and i dont care what anyone says about it being all bad wen its really not ive been here since late '07 and its been good but it would be better if we kept ms bond.... the band is really great i know because in im in it i play the trumpet and as the section leader we try hard and we play hard and also have fun but the chjool does have its bad people ... like kids tht ditch and sum even smoke but hey.... thts how they were raised..... Centennial is the best school in compton... its Better than Compton high and Dominguez....... the baseball team is the best outta all three and im the only lefty on the team so whoever need tht look 4 a knuckleball haha..... Go BIG TEN!!! 10
- Reviewed by Student on September 09, 2010
- Rating: (5 / 5) Flag as inappropriate
- well, what can i say? over all this school tries hard in every thing the school participates in. Such as parades, basketball games and football games and many more. There are some teachers that actually care for the students education. I am a senior this year and so far everything is going well.The school does need a little bit of touch ups such as the fields and cafeteria and etc. But the school is good and im a proud student of the apache land.
- Reviewed by Parent/Guardian on July 10, 2010
- Rating:
 (1 / 5) Flag as inappropriate
 - i graduated 1982, back then were only 5 hispanic and all the teachers suck they were black and they did not care about us
- Reviewed by Student on May 20, 2010
- Rating: (5 / 5) Flag as inappropriate
- WHAT CAN I SAY ITS, NOT THE BEST SCHOOL IN THE WORLD BUT THE TEACHER ARE GOOD AT WHAT THEY DO AND THEY DO CARE ABOUT THE STUDENTS BUT AS A BAND MEMBER THE BAND IS WHAT CEPT ME GOING THEIR I LOVE THIS SCHOOL AND THE BAND THE MOST I HOPE AND PRAY THAT WITH ALL THE BUGET CUTS GOING ON THAT THEY WONT CUT THE BAND. IT’S THE BAND THAT BRINGS IN ALL THE TROPHIES THAT’S IF U REALLY PAY ATTENTION TO IT.... THER HAVE BEEN ROMER SERCULATING SAYING THAT THER ARE GOING TO CUT THE BAN BECAUSE OFF THE BUGET BUT IF U DO CUT IT.... ITS LIKE CUTING THE SCHOOLS HEART OUT ITS THAT BAND THAT LIFTS THE MORAL OFF THE SCHOOL ........FURTHER MORE IF THE BAND IS CUT I WILL HAVE THE FULL SUPORT OF THE COMUNITY AND ALUMIE THAT WILL PUTISION FOR THE BAND REINSTATMENT ... AND ONE OTHER THING I WOUOLD HEVE TO SAY IS THAT WE NEED LOCKERS AND AN ADUTORIUM WOULD BE NICE AS WELL PLEAS AND THANK YOU CLASS MEMBER OF THE GRADUATING CLASS OF 2010
- Reviewed by Parent/Guardian on May 20, 2010
- Rating: (5 / 5) Flag as inappropriate
- WHAT CAN I SAY ITS, NOT THE BEST SCHOOL IN THE WORLD BUT THE TEACHER ARE GOOD AT WHAT THEY DO AND THEY DO CARE ABOUT THE STUDENTS BUT AS A BAND MEMBER THE BAND IS WHAT CEPT ME GOING THEIR I LOVE THIS SCHOOL AND THE BAND THE MOST I HOPE AND PRAY THAT WITH ALL THE BUGET CUTS GOING ON THAT THEY WONT CUT THE BAND. IT’S THE BAND THAT BRINGS IN ALL THE TROPHIES THAT’S IF U REALLY PAY ATTENTION TO IT.... THER HAVE BEEN ROMER SERCULATING SAYING THAT THER ARE GOING TO CUT THE BAN BECAUSE OFF THE BUGET BUT IF U DO CUT IT.... ITS LIKE CUTING THE SCHOOLS HEART OUT ITS THAT BAND THAT LIFTS THE MORAL OFF THE SCHOOL ........FURTHER MORE IF THE BAND IS CUT I WILL HAVE THE FULL SUPORT OF THE COMUNITY AND ALUMIE THAT WILL PUTISION FOR THE BAND REINSTATMENT ...
- Reviewed by Student on May 20, 2010
- Rating: (5 / 5) Flag as inappropriate
- WHAT CAN I SAY ITS, NOT THE BEST SCHOOL IN THE WORLD BUT THE TEACHER ARE GOOD AT WHAT THEY DO AND THEY DO CARE ABOUT THE STUDENTS BUT AS A BAND MEMBER THE BAND IS WHAT CEPT ME GOING THEIR I LOVE THIS SCHOOL AND THE BAND THE MOST I HOPE AND PRAY THAT WITH ALL THE BUGET CUTS GOING ON THAT THEY WONT CUT THE BAND. IT’S THE BAND THAT BRINGS IN ALL THE TROPHIES THAT’S IF U REALLY PAY ATTENTION TO IT.... THER HAVE BEEN ROMER SERCULATING SAYING THAT THER ARE GOING TO CUT THE BAN BECAUSE OFF THE BUGET BUT IF U DO CUT IT.... ITS LIKE CUTING THE SCHOOLS HEART OUT ITS THAT BAND THAT LIFTS THE MORAL OFF THE SCHOOL ........FURTHER MORE IF THE BAND IS CUT I WILL HAVE THE FULL SUPORT OF THE COMUNITY AND ALUMIE THAT WILL PUTISION FOR THE BAND REINSTATMENT ... OH AND ONE CLASS OF THE TEN WAS THE BEST SO FAR 2010
- Reviewed by Former Student on January 03, 2010
- Rating: (5 / 5) Flag as inappropriate
- It so sad to read the negative notes about my Alma Mater and neighborhood school, Centennial High ( The Big Ten )
Of course it was 1964 when I graduated, therefore, I'm sure the neighborhood and school has changed greatly but it doesn't lower my sadness.
I feel certain things should remain classic; things like great neighborhoods and high schools in those neigborhoods.
Here I come back after the military, college, at the ending of my chosen career to find individuals suffering. Sad.
Maybe once I retire ( I'm hoping to work ten more years ) I can return and help for I do have property in that area.
- Reviewed by Student on November 08, 2009
- Rating: (1 / 5) Flag as inappropriate
- If your planning on putting your child in Centennial High please dont. Its a waste of time and they do a poor job in security, administration, tardy sweeps and riots. This is my second year there and i hate it. Im trying to transfer out but i dont know when im getting out of that school.
- Reviewed by Former Student on May 24, 2009
- Rating: (5 / 5) Flag as inappropriate
- i need information about my high school diploma
- Reviewed by Student on March 29, 2009
- Rating: (5 / 5) Flag as inappropriate
- this school is out of control the staff have no control and its a fact
- Reviewed by Community Member on February 03, 2009
- Rating: (5 / 5) Flag as inappropriate
- I drive everyday past this school and see a few crimes every now and then the school is doing great its the POLICE not doing they job enough
- Reviewed by Student on February 02, 2009
- Rating: (5 / 5) Flag as inappropriate
- Centennial High School is not a bad school at all. Though the teachers may not teach us that much , it is still a overall GOOD school. it might be in a bad neighborhood (in the eyes of some) but this school is great i love it.
- Reviewed by Student on October 02, 2008
- Rating: (5 / 5) Flag as inappropriate
- I'M A STUDENT HERE, AND EVEN THOUGH THIS SCHOOL HAS BEEN RATED BADLY, IT'S NOT THAT BAD. THE TEACHERS ARE GREAT AND THE STAFF TOO. THE SCHOOL CARES ABOUT THEIR STUDENTS. THIS IS MY FRESHMAN YEAR AND IT HAS BEEN GREAT SO FAR. THIS SCHOOL DOES HAVE A LONG WAY TO GO, BUT I KNOW THAT IT WILL ACHIEVE.
- Reviewed by Student on August 02, 2008
- Rating: (5 / 5) Flag as inappropriate
- I know that over the past Centennial High School has been known as the school that everyone goes to if they can't get into a better school. But I believe under the new principal, that this school will become a better thought of school. I am very excited to see the greatly needed changes be done under her. I know that centennial was not my first choice for high school but I am still proud to say that in September I will become a freshmen at Centennial High school. I am interested in the Athletics at centennial because from the school website and from playing there before I am sure that joining Teams there will be great.
- Reviewed by Student on August 04, 2007
- Rating:
 (3 / 5) Flag as inappropriate
 - this school has potential we just need much more parent participation and teachers, its an over crowded school just like any other overcrowded school and i consider it to be a "push out" school. the students and staff and parents is what makes centennial centennial not the building but when the building is old and not enough classrooms the students and teachers feel like that's what they deserve and that's all they will ever achieve to be under or inferior. but i think the school has potential it just needs more guidance.
- Reviewed by Former Student on May 18, 2007
- Rating: (1 / 5) Flag as inappropriate
- THIS IS THE WORST HIGH SCHOOL EVER!
THEY LOST MY RECORDS FROM MY SENIOR YEAR, AND WHAT THEY HAVE LOOKS AS THOUGH I DIDN'T GRADUATE! I HAVE MY PICTURES FROM GRADUATION, AND MY DIPLOMA, AND I AM TRYING TO RETURN TO COLLEGE, AND CAN'T EVEN ENROLL BECAUSE THEY WANT TO SEE MY OFFICIAL TRANSCRIPTS, BECAUSE MY DIPLOMA IS NOT ENOUGH TO VERIFY, DUE TO PEOPLE MAKING FAKE DIPLOMAS. COMPTON UNIFIED SCHOOL DISTRICT AS A WHOLE IS UNSATISFACTORY. THEY LOST MY PARENTS RECORDS. WHO DIDN'T EVEN GO TO THE SAME SCHOOL. MY AUNTS RECORDS BURNED IN A FIRE IN THE ADMINISTRATION BUILDING BECAUSE THEY WERE DUMB ENOUGH TO NOT PUT THEM IN THE COMPUTER SYSTEM. AND HALF OF MY GRADUATION CLASS IS HAVING THE SAME PROBLEM THAT I AM. NEITHER THE DISTRICT OR THE STATE CAN DO ANYTHING!
WORST SCHOOL AND DISTRICT EVER. THEY HARDLY EVEN TEACH WHAT IS ON THE SAT. IF I WOULDN'T HAVE TAKEN A COURSE THAT COVERED EVERYTHING ON THE SAT, I WOULD BE OUT OF LUCK. MOST OF THE PEOPLE I KNOW THAT I GRADUATED WITH, THAT TOOK THE SAT, DIDN'T DO ALL THAT WELL BECAUSE THEY HARDLY KNEW WHAT WAS ON THERE AND THEY WERE ALL GREAT STUDENTS.
Read All 19 Reviews ->
School Map and Similar Schools Nearby
Click to Activate Map of Nearby School Campuses
Private
Public
This School
Similar Schools Nearby
| Thurgood Marshall School KG-12 | 14 Students | 0.9 miles away |  5 out of 5 | - |
| Jordan New Technology High School 9-12 | 237 Students | 2.3 miles away | Not Yet Rated | - |
| Compton High School 9-12 | 2,469 Students | 2.3 miles away | Not Yet Rated | |
| International Studies Learning Community School 6-12 | 782 Students | 2.5 miles away | Not Yet Rated | |
| South East High School 9-12 | 2,855 Students | 2.8 miles away | 5 out of 5 | |
| Middle College High School 9-12 | 379 Students | 3.2 miles away | Not Yet Rated | |
| George Washington Preparatory High School 9-12 | 2,130 Students | 3.3 miles away |  4.5 out of 5 | |
| California Academy of Mathematics and Science 9-12 | 625 Students | 3.4 miles away | 5 out of 5 | |
| South Gate High School 9-12 | 3,289 Students | 3.7 miles away | 4.5 out of 5 | |
| John C. Fremont High School 9-12 | 4,470 Students | 3.9 miles away | 5 out of 5 | |
Compare This School To Nearby Schools ->
School Community Forum

Join a discussion about Centennial High School and talk to others in the community including students, parents, teachers, and administrators.
Popular Discussion Topics
- Admissions and Registration Questions (e.g. Dress Code and Discipline Policy)
- School Calendar and Upcoming Events (e.g. Graduation)
- After School Programs, Extracurricular Activities, and Athletics (e.g. Football)
- News and Announcements (e.g. Yearbook and Class Supply List Details)
- Graduate and Alumni Events (e.g. Organizing Class Reunions)
Navigation
Can't Find What You Are Looking For?
Rankings
Nearby Cities
Sponsored Links
K-12 Articles

Teaching Your Child Study Skills
Many children who have the capability to get good grades experience frustration because of low...
Many children who have the capability to get good grades experience frustration because of low...

Teaching Kids to Deal with Peer Pressure
Parents usually become very concerned when they hear the term "peer pressure." However, peer...
Parents usually become very concerned when they hear the term "peer pressure." However, peer...

Break the Cycle: Teen Dating Violence and Prevention Week
February 5 through 9 was "National Teen Dating Violence Awareness and Prevention Week"....
February 5 through 9 was "National Teen Dating Violence Awareness and Prevention Week"....